
Probably less than you think. Lessons from hard data.
Let me prepare you for the simple, yet stunning chart a few inches below. Here is what it says: you are probably taking on way too much risk in your portfolio. And, before you say “but I need the kind of returns that the stock market index can provide,” let me stop you. Because unless you like spending decades running around in circles, you probably don’t.
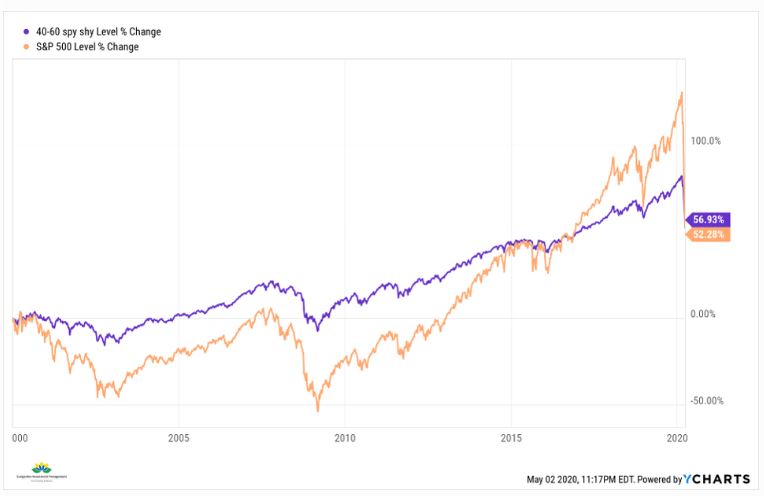
If you invested in SPY from the start of the year 2000, as the Dot-Com Bubble was peaking, you gained 52% over the next 20 years. My end point for that period is March 23, 2020, the date of the most recent S&P 500 Index bottom. Now, if you think the market will never reach that level again, good luck to you. But I do expect us to revisit it. So, if I still have your attention, let’s move on to a related subject.
Back in early 2000, if you instead invested 40% in an S&P 500 Index fund, and 60% in SHY (1-3 year Treasury ETF), you earned…wait for it…57%. That’s right, the tortoise beat the hare over the past 20 years.
At this point you might be tempted to point out that this period included 2 vicious bear markets (2000-2003 and 2007-2009), and the recent 33% plunge earlier this year. You might be recalling the calming words of your financial advisor or one of the behemoth 3rd party investment managers they get some of their educational (a.k.a. sales material) from. You know, the “bear markets are part of investing,” and “its time in the market, not timing the market.”
You’ve got time…but do you need it?
Well, how much time do you have? Because there is an excellent chance we just entered a bear market. So, if your rose-colored glasses are telling you that this is a “great long-term buying opportunity,” just pause for a second. When you do, you will realize that the start of a bear market is a pretty tenuous time to start filling your portfolio with stocks. In fact, that chart might be good evidence that there is no time to be filling your portfolio with stocks.
The point I am making is a broad one, but a crucial one for investors right now. After all, the data shows pretty clearly that taking stock market index-level risk is something that does not necessarily work out.
Long-term index investing: a nice way to sell the dream, but…
Over selected time periods (that is, selected by a financial salesperson), the S&P 500 Index blows away many rival investments. Just ask a small cap manager, an international equity manager, or a variety of other strategy managers who have tried for years to explain that the S&P 500 was not a one-decision investment plan (buy, and never sell).
But you can see how the market only needs to hit a rough patch for a fraction of a long-term time period to take all of the benefits out of taking full-market risk. As it turns out, you could have “risked” $40 of every $100 instead of the entire $100. That should alert you to one of my major investment tenets: use the stock market as a tool to get what you want. Don’t just “invest” in it through an index fund and count on time to make your retirement dreams happen.
The key point of showing this is to remind you that long-term returns are far less about “being a long-term equity investor” or “riding out the bumps along the way.” Success over longer time periods is primarily about not getting crushed when everyone around you is. Markets give back a lot of progress in a short amount of time.
Like an NFL “Pick-6”
It’s like an 80-yard “pick-6” in football (back when live sports were on TV). Just when you thought you were getting close to scoring (retiring in the manner you wish), it goes the other way, really fast. That’s what every investor needs to contemplate. I will talk about “the how” of this in my next article.
Related: How To Interpret The S&P 500 Rally