
Written by: Joseph M. Graham | Lord Abbett
Income is back in fixed income. The front end of the curve may offer a way to earn that income while avoiding some of the risk.
Attractive Yields While Limiting Rate Risk
We’ve written and spoken a lot about the potential benefits of short-duration credit over the last few years. This focus has been motivated by substantial evidence for long-term outperformance at the short end of the yield curve, as well as the needs of investors to:
- Earn a return on uninvested cash reserves.
- Diversify from the term risk prevalent in the rest of the fixed-income market.
Those needs are still pressing today. The drag of holding cash is expensive as inflation continues to run well in excess of pre-pandemic norms. Investors need ways to outpace this inflation with the portion of their portfolios designated for principal protection.
We believe diversifying term risk should also still be a priority for fixed-income investors. Though the yield picture for longer-term fixed income has certainly improved since the beginning of 2022, the yield curve remains stubbornly flat overall and inverted at key points (see Figure 1), providing very little, if any, compensation for taking on incremental interest-rate risk.
Figure 1. Short-Term Rates Have Adjusted to Reflect Future Fed Rate Hikes
U.S. Treasury yield curves for indicated dates
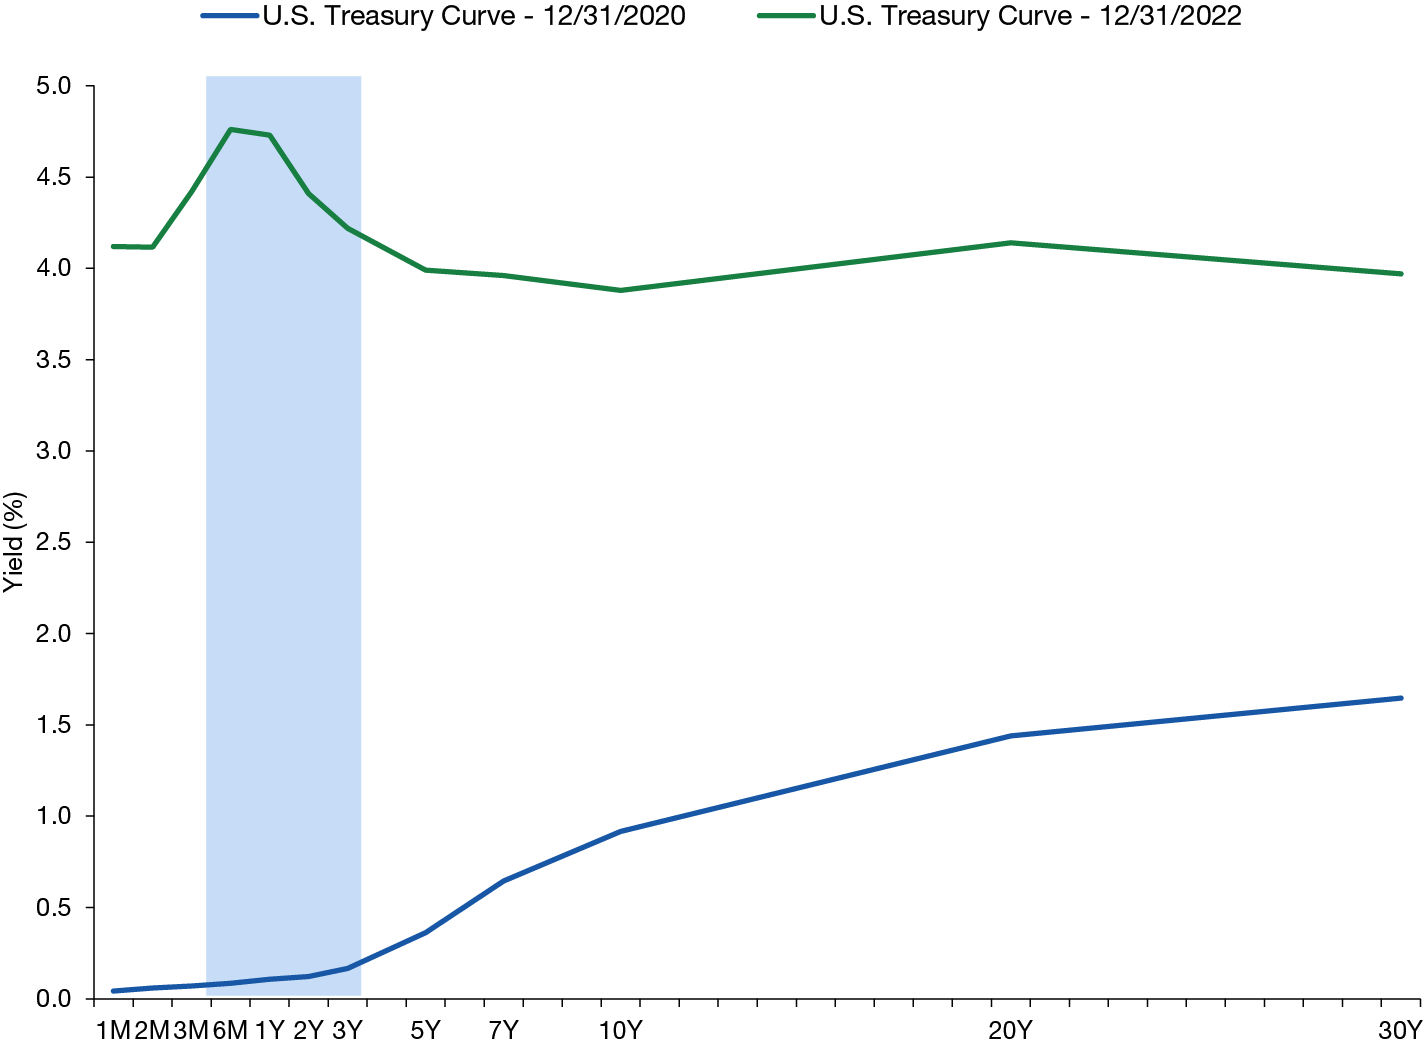
Source: Bloomberg. Data as of 12/31/2022. A yield curve is a line that plots the interest rates, at a set point in time, of bonds having equal credit quality, but differing maturity dates. The most frequently reported yield curve compares the three-month, two-year, five-year and 30-year U.S. Treasury debt. For illustrative purposes only and does not represent any specific portfolio managed by Lord Abbett or any particular investment
Longer-term interest-rate uncertainty—compensation known as “term premium”—may not be properly reflected in long-term bond yields (see Figure 2).
Figure 2. Negative Term Premium Still a Long Way from Typical
Term premium on 10-year U.S. Treasury note and the year-over-year change in the U.S. Consumer Price Index (CPI), June 14, 1961-December 31, 2022
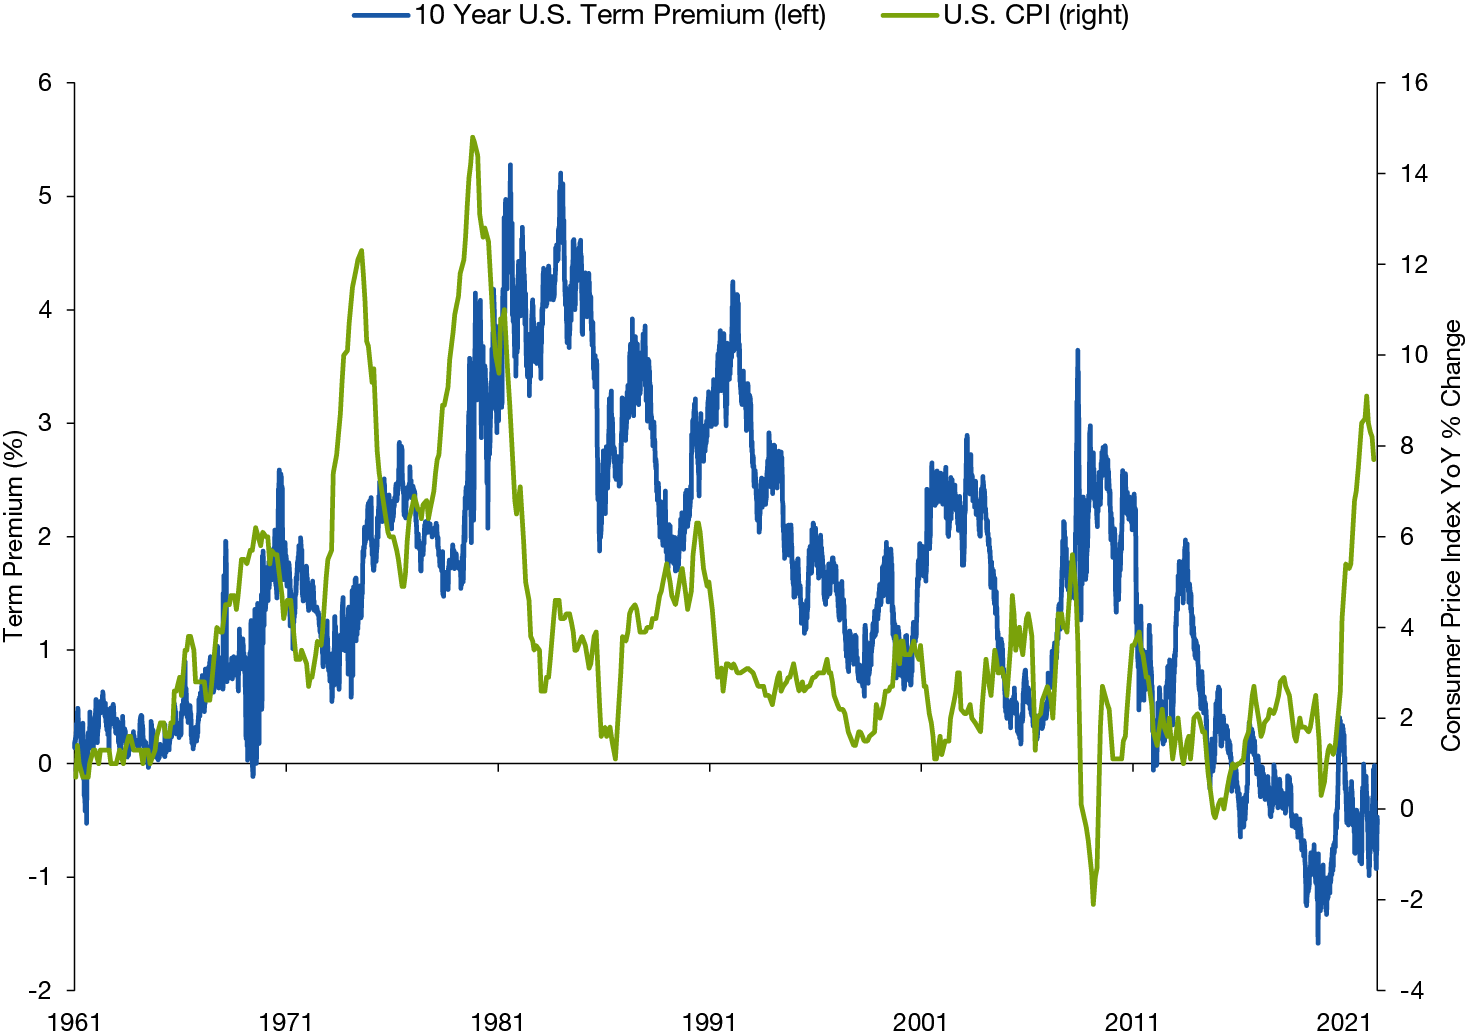
Source: Bloomberg and Federal Reserve Bank of New York. Data as of 12/31/2022. Term premium represented by ACMTP10. Inflation represented by the year-over-year change in the U.S. Consumer Price Index (CPI). Past performance is not a reliable indicator or guarantee of future results. For illustrative purposes only and does not represent any specific portfolio managed by Lord Abbett or any particular investment. Indexes are unmanaged, do not reflect the deduction of fees and expenses, and are not available for direct investment.
Beyond the tactical consideration of today’s term premium, 2022 taught investors that one common risk, which is the rate risk that comes with longer-term fixed income, can affect every investment in their portfolio together. Adequately priced or not, this risk and its impact on portfolios should be diversified, and short-duration credit is one potential way to limit rate risks associated with longer-term bonds.
The evidence for outperformance of short duration has only improved over the last year, as rising rates damaged longer-term fixed income performance in 2022. Short-duration credit indexes significantly outperformed longer-duration credit segments, with rising rates the primary driver of negative returns as opposed to credit events, shown in Figure 3.
Figure 3. Duration Exposure Increased the Negative Impact of Rising Rates
Contribution to index total returns in 2022 as of December 31,2022
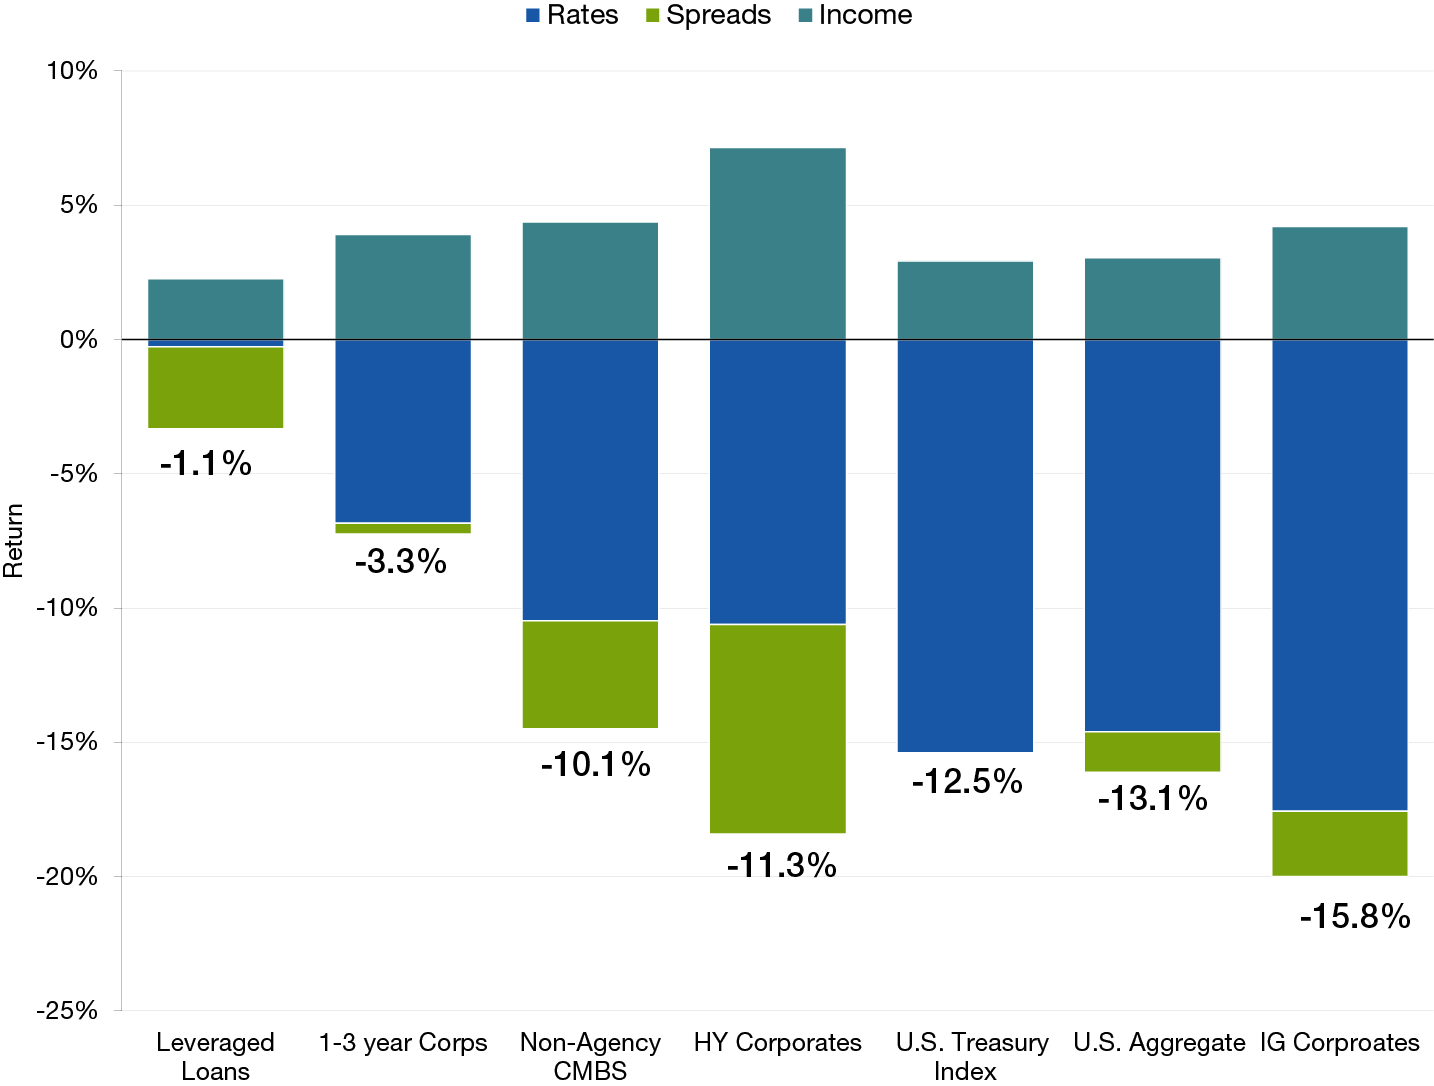
Source: FactSet. Data as of 12/31/2022. Bloomberg indexes: Bloomberg U.S. Treasury Index, Bloomberg U.S. Aggregate Index, Bloomberg Non-Agency CMBS (commercial mortgage-backed security) U.S. Aggregate-Eligible Index, Bloomberg U.S. Corporate Index, Bloomberg U.S. Corporate High Yield Index. Leveraged Loans = Credit Suisse Leveraged Loan Index. Past performance is not a reliable indicator or guarantee of future results. The historical data shown in the chart above are for illustrative purposes only. Due to market volatility, the market may not perform in a similar manner in the future. For illustrative purposes only and does not represent any specific portfolio managed by Lord Abbett or any particular investment. Indexes are unmanaged, do not reflect the deduction of fees and expenses, and are not available for direct investment.
The Low-Risk Anomaly and Higher Risk-Adjusted Returns
Short-duration credit has historically produced higher Sharpe ratios than long-duration credit, as shown in Figure 4. This outperformance of short duration over the last few decades is not all that surprising. Anomalous, risk-adjusted returns for low-risk market segments are common across asset classes and time periods.1
Figure 4. Short-Duration Core Bonds Produced Higher Sharpe Ratios
Sharpe ratios by credit quality and effective duration within the Bloomberg U.S. Aggregate Bond Index, December 31, 1997, to December 31, 2022
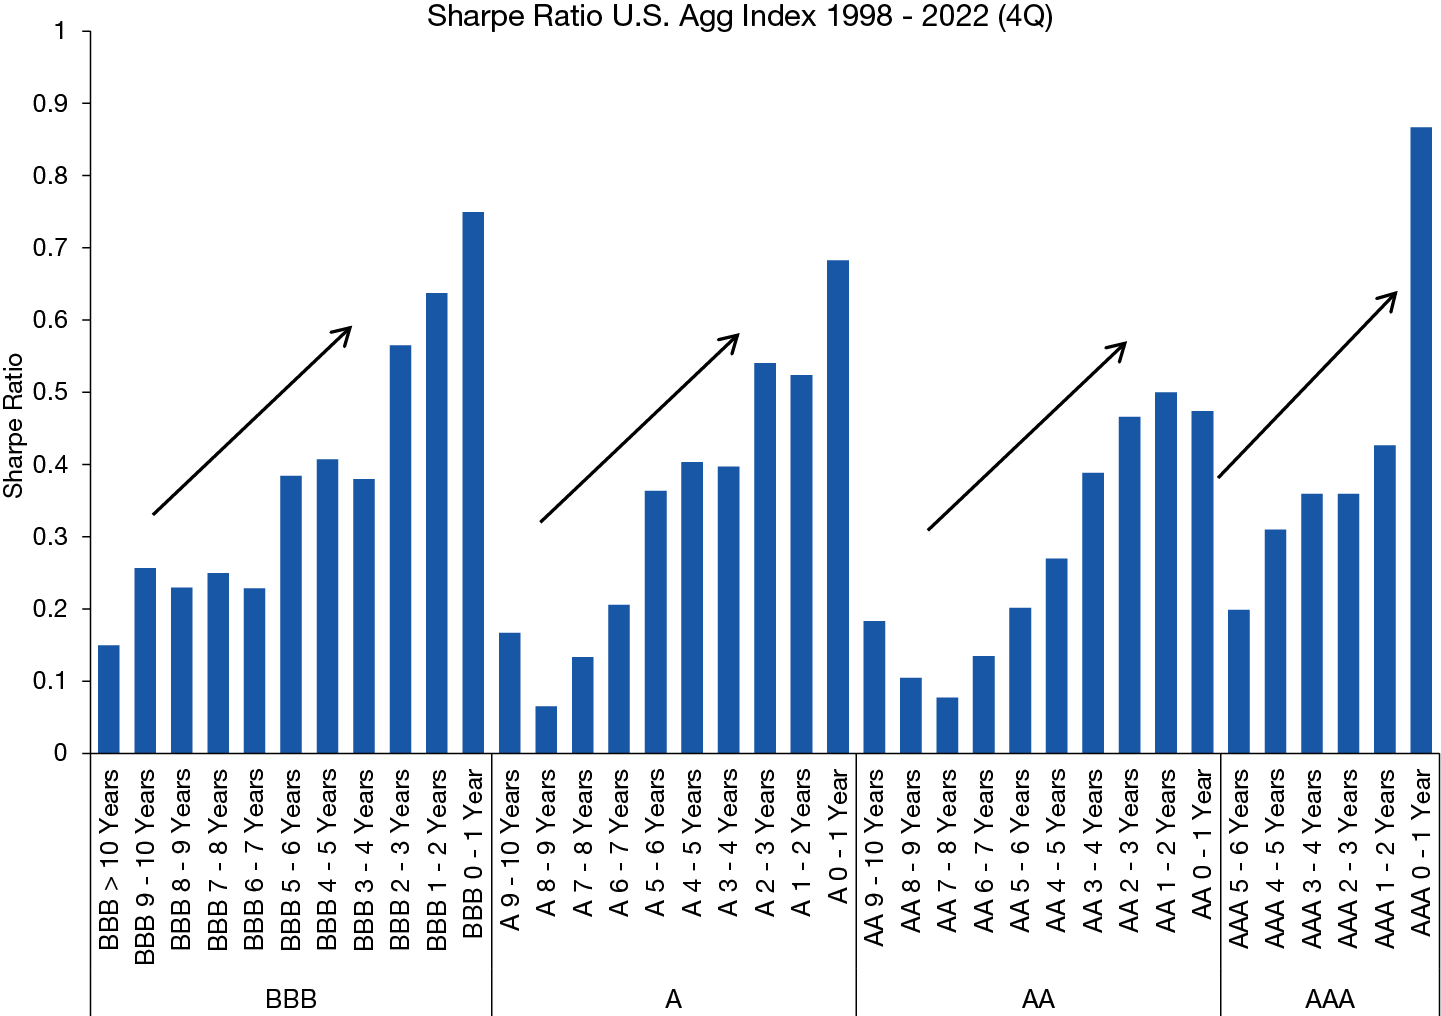
Source: Bloomberg. Data as of 12/31/2022. Past performance is not a reliable indicator or guarantee of future results. For illustrative purposes only and does not represent any specific portfolio managed by Lord Abbett or any particular investment. Indexes are unmanaged, do not reflect the deduction of fees or expenses, and are not available for direct investment.
The reasons for this anomaly are varied, but some of the most important are as follows:
- Investor attention on higher risk-and-reward opportunities resulting from overconfidence, agency issues, or justification of the time and effort put into the research process—and consequent inattention to low-risk areas.
- Constraints on leverage, particularly in low-spread asset classes where frictional costs inhibit leverage or areas with non-normal distributions of returns. Negatively skewed and fat-tailed returns are less attractive to risk-averse or leveraged investors.
- Non-economic constraints arising from agency issues commonly found in investment guidelines and investment management agreements that limit investor flows to certain issuer types, qualities, registration types, or maturities.
A Flexible, Multi-Sector Approach to Find Excess Returns
We often see these behavioral biases in action within the short-duration credit space. As allocators reel from the speed and magnitude of the rate repricing of 2022 and prepare for a likely recession in 2023, they now have even less reason to go further afield with short-term rates well above their 2021 lows.
As a result, opportunities abound for mandates that can be flexible. For example, currently, investment-grade, securitized issues, such as AAA-rated, short-duration CMBS (commercial mortgage-backed security) and ABS (asset-backed security), offer excellent overall yield and spreads in spaces where the underlying credit is performing well, and the structure is likely to weather even a severe recession (see Figure 5).
Figure 5. Attractive Spreads on AAA-Rated, Short-Duration CMBS and ABS
Option-adjusted spreads (OAS) on indicated indexes, December 31,2016-December 31, 2022

Source: Bloomberg. Data as of 12/31/2022. Indexes: Bloomberg AAA CMBS 1-3.5 Year Index, Bloomberg AAA ABS 1-3 Year Index and the ICE BofA 1-3 Year A-Rated Corporate Index. Past performance is not a reliable indicator or guarantee of future results. For illustrative purposes only and does not represent any specific portfolio managed by Lord Abbett or any particular investment. Indexes are unmanaged, do not reflect the deduction of fees or expenses, and are not available for direct investment.
The Case for Short-Duration High Yield
Short-duration high yield is another area of investor inattention from both sides of the risk spectrum. High yield investors typically want more leverage with their research decisions, including the higher convexity of longer-dated bonds. Short-duration investors tend to find the investment space too resource-intensive and negatively skewed. Only a small amount of mutual fund assets in high yield bonds are focused on short-duration high yield. As a result of this inattention, short-duration high yield has starting yields on par with longer-duration high yield, with substantially less default risk (see Figure 6).
Figure 6. Short Maturities Offer Similar Compensation for Lower Default Risk
Average BB-rated and B-rated high yield index option-adjusted spreads (OAS) by maturity, December 31, 1997, to December 31, 2022 (left), and cumulative default rates by rating, December 31, 2011, to December 31, 2020 (right)
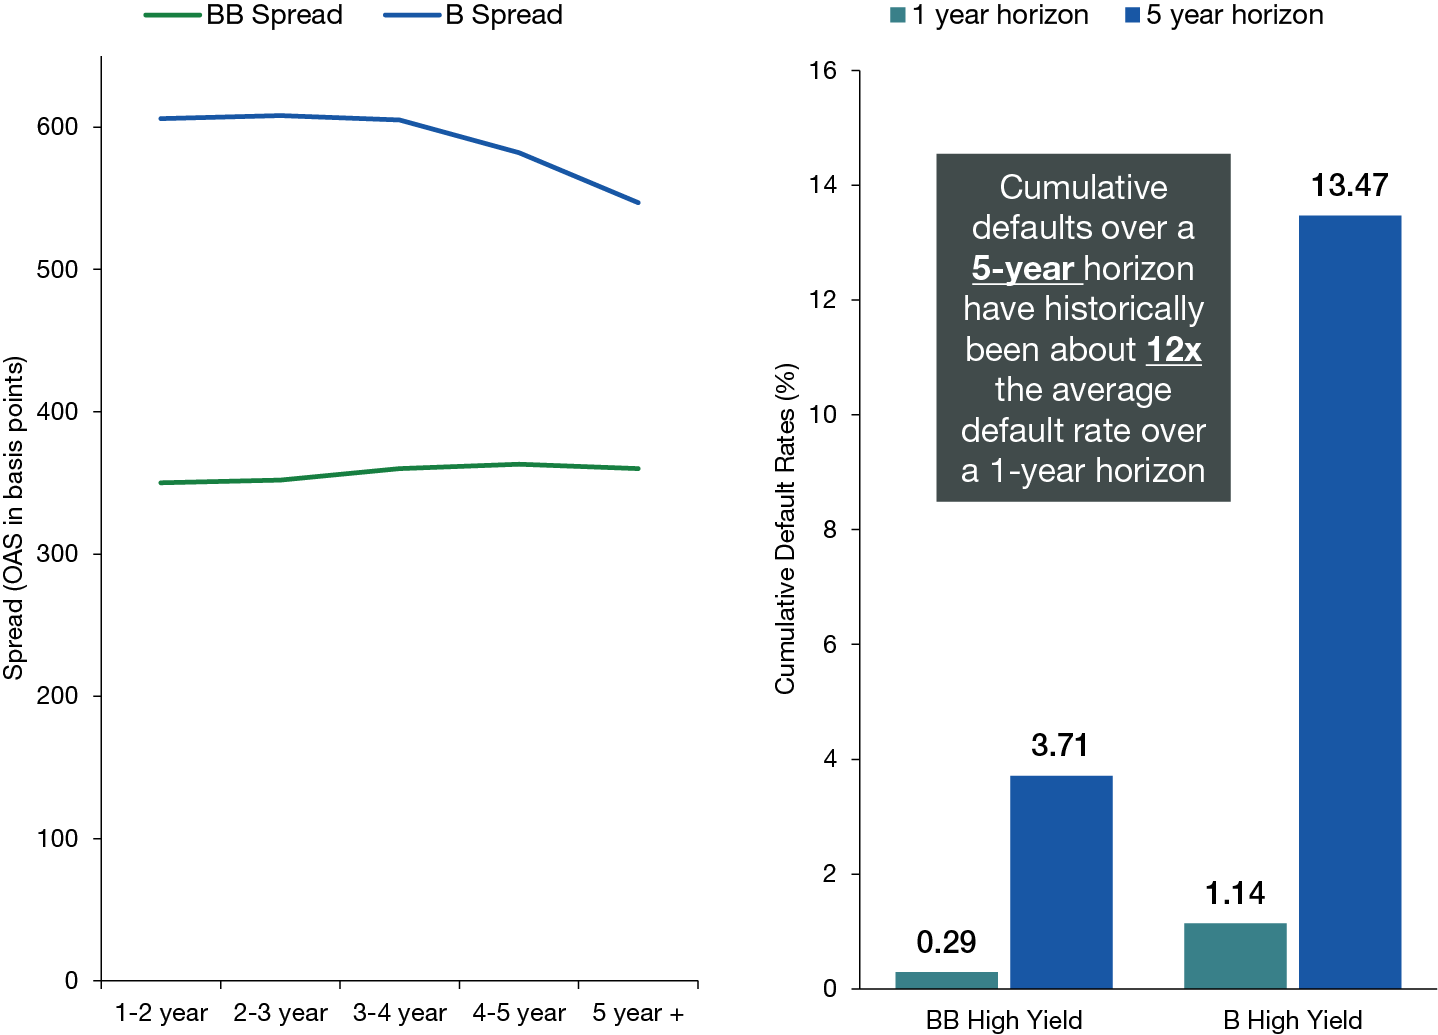
Source: ICE Data Indices, LLC. And Moody’s Study of Corporate Defaults, 1970-2020. Data as of 12/31/2022 (left). Data as of 12/31/2020 (right), most recent available. ICE BofA BB-Rated High Yield Bond Index and ICE BofA B-Rated High Yield Bond Index. Past performance is not a reliable indicator or guarantee of future results. For illustrative purposes only and does not represent any specific portfolio managed by Lord Abbett or any particular investment.
The default risk that these yields compensate for increases as the time to maturity increases, of course. What’s less obvious is that this default risk increases more than linearly. For example, a default on a company that currently has adequate cash flow requires a change, a competitive de-evolution. That change tends to be small at first but builds over time. This means the environment generally is not much different over two-year periods but can be remarkably different over five or 10 years. Therefore, default uncertainty increases substantially over that longer time frame. We believe defaults and losses will likely tick up over the next year but will remain low relative to other recessions due to corporate balance-sheet and consumer strength.
The attractive yields and lower defaults on short-duration high yield have contributed to historically higher excess returns over time. Short-duration segments within the ICE BofA U.S. High Yield Index have delivered higher Sharpe ratios compared to longer-duration segments, as shown in Figure 7.
Figure 7. Higher Sharpe Ratios for Shorter-Duration High Yield
Sharpe ratios by duration and credit quality within the ICE BofA U.S. High Yield Bond Index, December 31, 1996, to December 30, 2022
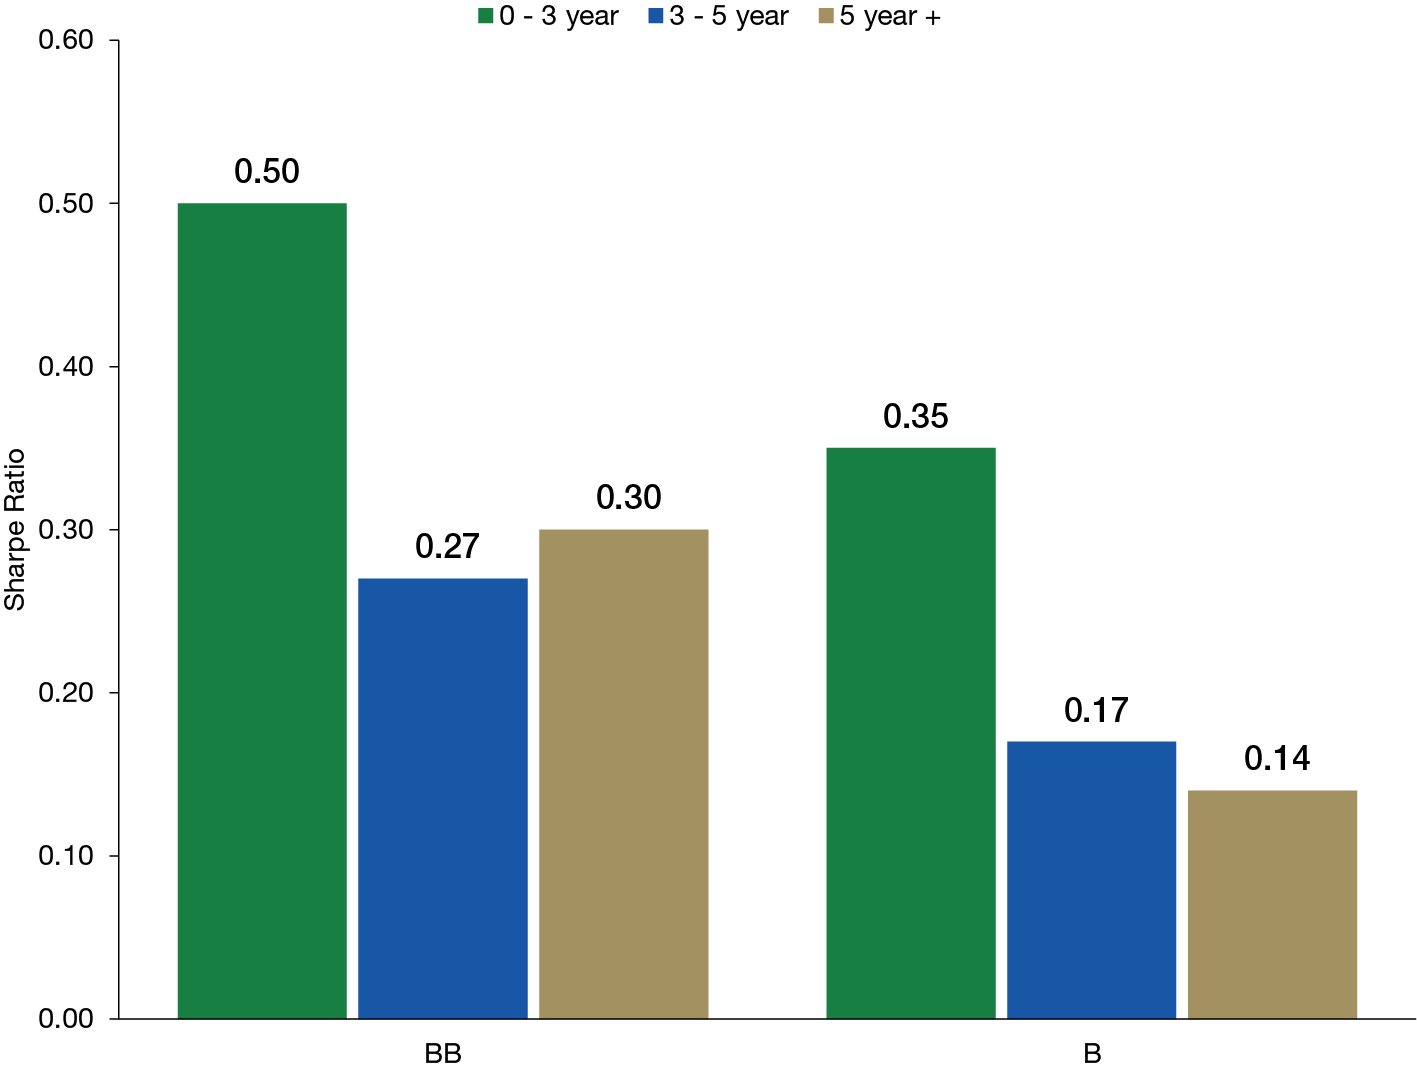
Source: ICE Data Indices, LLC. Data as of 12/31/2022. Past performance is not a reliable indicator or guarantee of future results. For illustrative purposes only and does not represent any specific portfolio managed by Lord Abbett or any particular investment. Indexes are unmanaged, do not reflect the deduction of fees or expenses, and are not available for direct investment.
Yield levels are high enough today that investors may want to consider short-duration high yield for return-seeking segments of asset allocations that are generally reserved for equities. The yield to worst (YTW) on the ICE BofA 1-5 Year U.S. High Yield Index exceeds the current earnings yield on equities (see Figure 8)—an uncommon event over the last 15 years, and possibly an auspicious one as margin pressure may continue to bring those earnings estimates down—a potential headwind for stocks.
Figure 8. Attractive Yield Compared to Current Earnings Yield on Stocks
ICE BofA 1-3 Year U.S. High Yield Index YTW and the S&P 500 Earnings Yield, December 31, 1996, to December 31, 2022
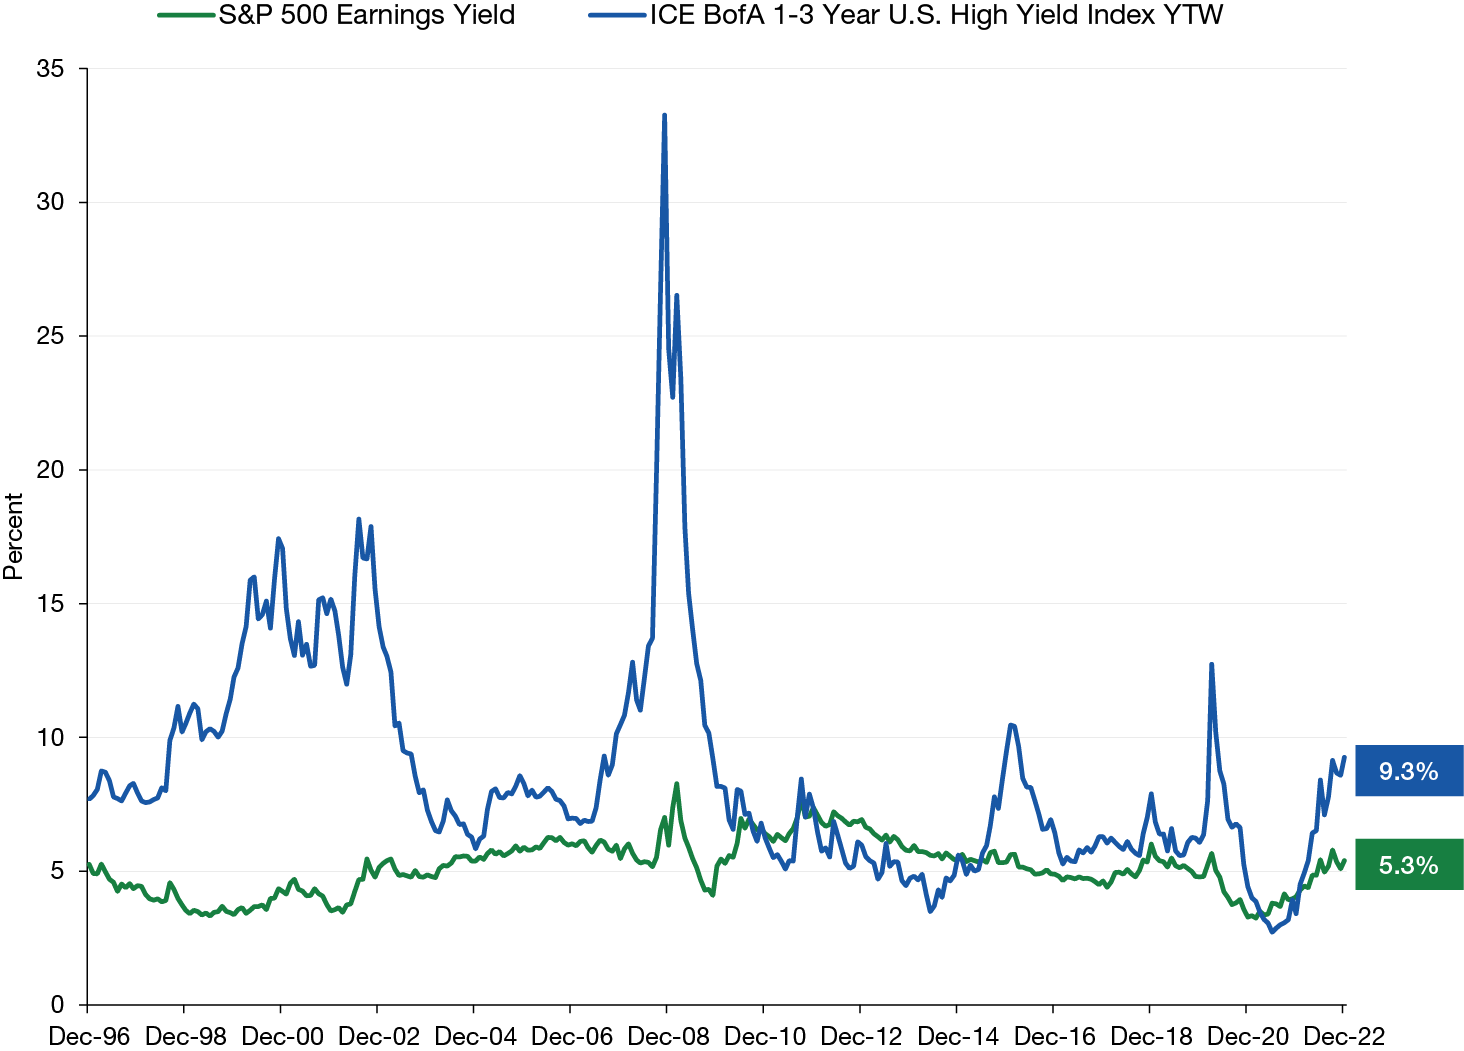
Source: Bloomberg and ICE Data Indices, LLC. Data as of 12/31/2022. Past performance is not a reliable indicator or guarantee of future results. For illustrative purposes only and does not represent any specific portfolio managed by Lord Abbett or any particular investment. Indexes are unmanaged, do not reflect the deduction of fees or expenses, and are not available for direct investment.
Key Takeaways
Capitalizing on the short-duration anomaly with a flexible, multi-sector mandate allows a well-resourced manager to balance liquidity needs, diversify risk, and earn excess returns from sector rotation and security selection.
Investors focused on return-seeking segments of their portfolios may want to consider a dedicated, short-duration high yield mandate. Attractive historical returns and an excellent yield-and-spread environment leave the asset class attractively positioned on both a relative and absolute basis.