
Written by: David Nelson, CFA CMT
Fresh on the heels of one of the worst investment quarters in my career, U.S. markets staged an impressive comeback with the Dow putting in its best 3 months since 1987 and for the Nasdaq, the best since 1999.
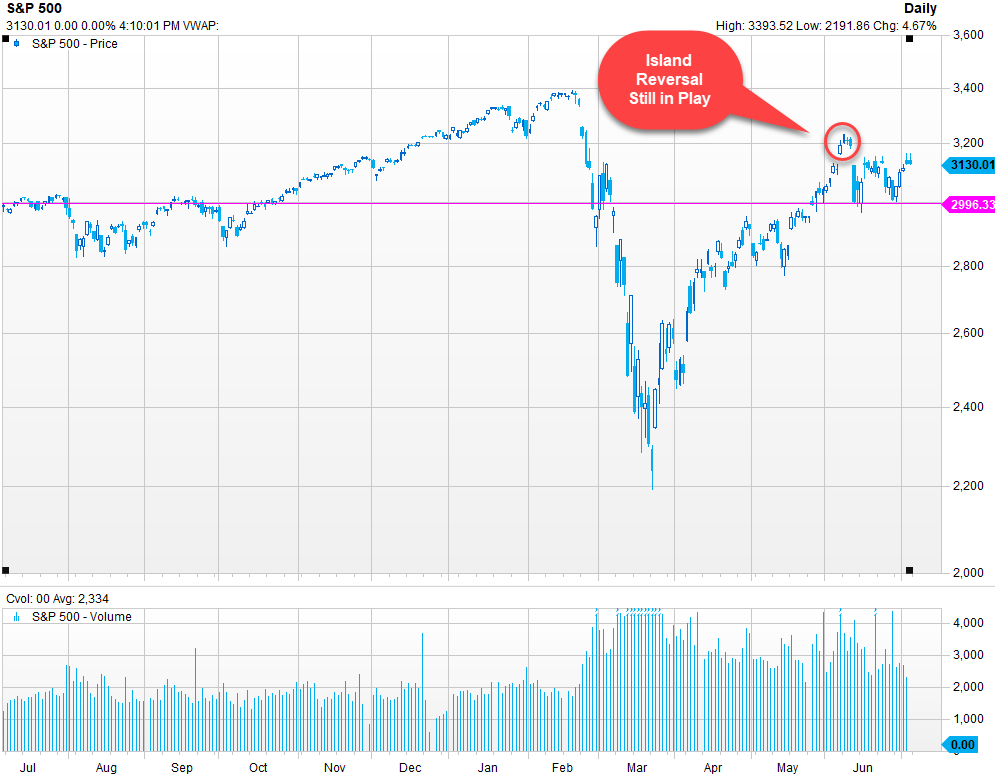
S&P 500 1 Year
With the backdrop of a pandemic, investors continue to be hostage to a news cycle that devours every scrap of data connected with COVID-19. The lead story on any financial broadcast is almost certainly in one way or the other connected to the virus and our efforts to contain it.
Quarter-end reviews are usually focused on performance relative to some benchmark discussing winners and losers along with an early look at the upcoming earnings season. Blah, blah, blah!
Somehow, given the current climate, traditional data points on individual stock performance just aren't going to cover it. It took just 23 trading days from market top to bottom and, short of a coronavirus vaccine and or cure, the look ahead is far from certain.
Virus deaths as a share of confirmed cases
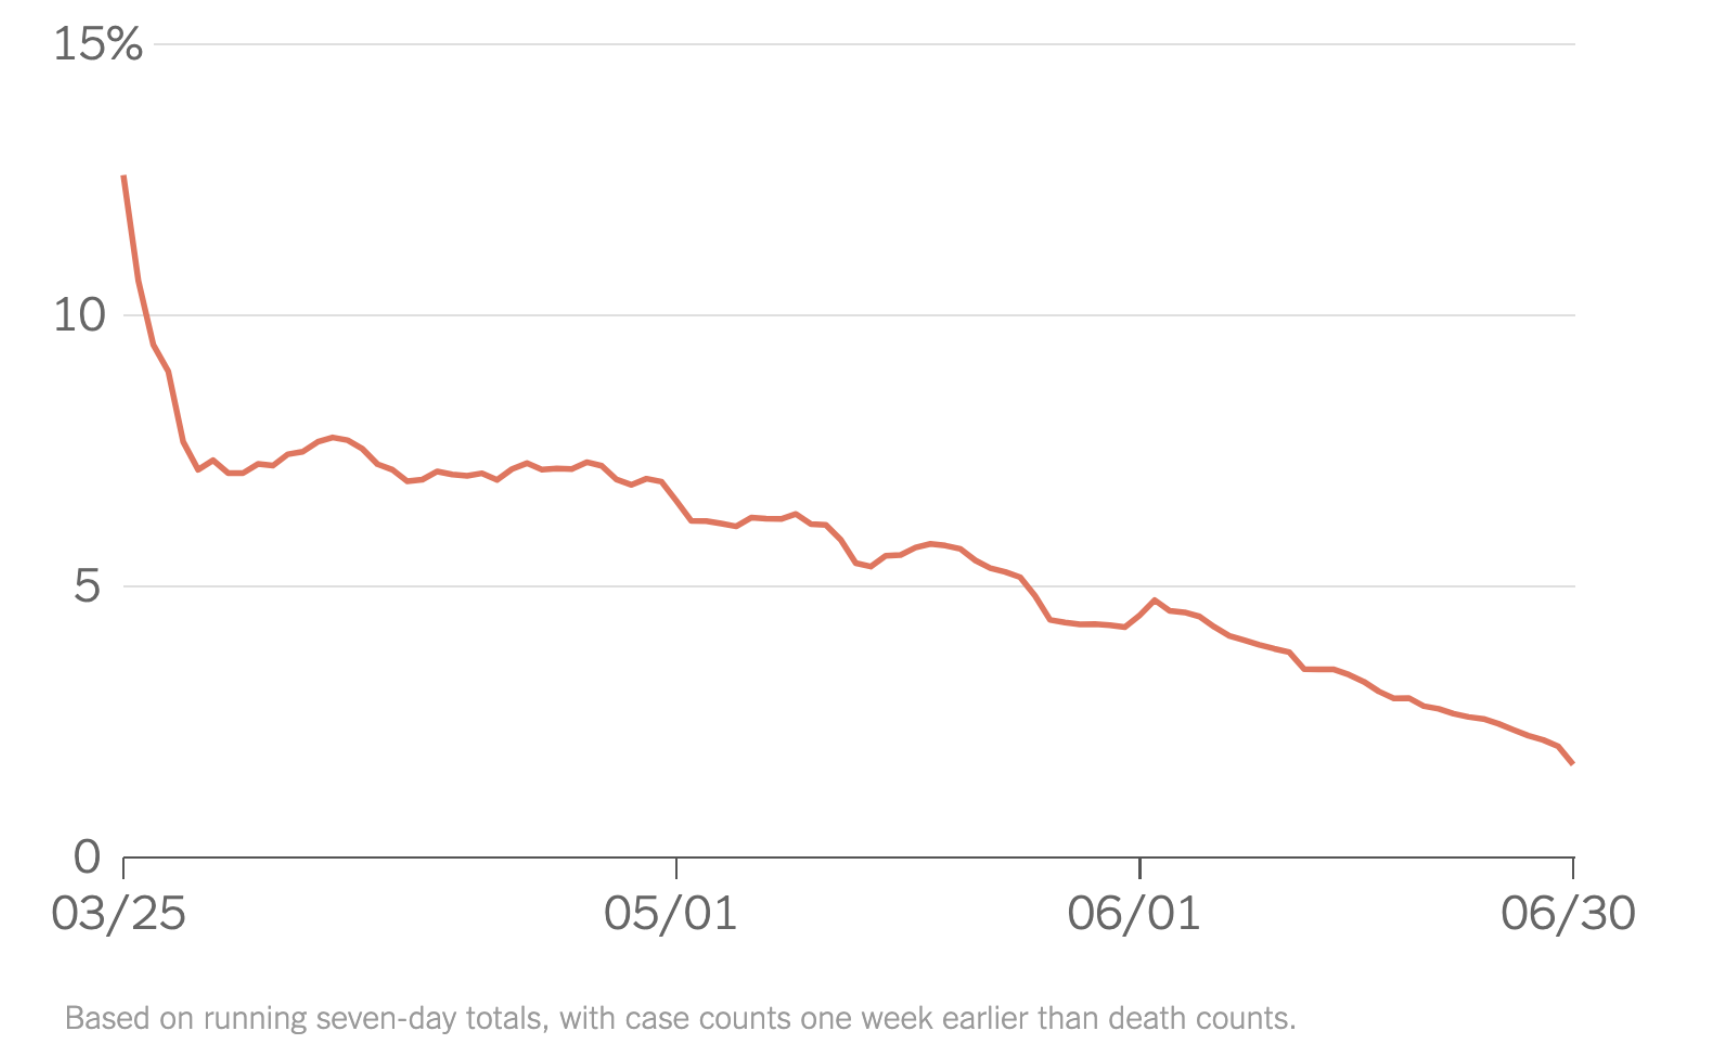
Source: The New York Times
Lost in the media commentary highlighting the rise of daily infections is the that the death rate for COVID-19 here in the states continues to decline. Learning how to cope with the disease until a vaccine or cure is discovered is paramount if we are going to continue to move on with the recovery.
States are in different stages of reopening their economies and, given some of the viral hot spots as well as a daily infection count crossing 50,000, it's clear we've become too complacent. As I pointed out in recent posts, here in my own building, few under 30 wear a mask or follow even some of the simple guidelines laid out by the CDC.
4th of July Montauk - In case you're wondering what sort of activity causes the infection rate to rise

Over the weekend I was in Montauk for dinner and it was clear once we got to the restaurant, there was little regard for social distancing or masks. It could have been any summer evening last year. I suspect this scene is playing out across America.
Jobs
Barely mentioned this holiday weekend was last week's record employment report. 4.8 million people went back to work in June. In addition, the unemployment rate dropped to 11%. Before we get too complacent ourselves, the 11% number is suspect and likely a lot closer to 15%. Once government programs start to roll off the pace of recovery will slow possibly even reverse. As an example, expect airlines to take the steps needed to remain solvent.
In return for $25 billion in bailouts, 30% of which must be paid back, airlines had to promise to not lay off any employees before October 1st. Delta has already informed pilots to expect 2,500 to be furloughed.
Americans can do the math
There is a heated debate in Washington over the next round of stimulus. I do not believe we can afford to pay workers more to stay at home than they would receive on the job as laid out in the CARES Act. Americans can do the math. Another round of stimulus is gaining traction but like most things on the Hill, the devil is in the details.
With the second quarter in the rear-view mirror economists are expecting a negative GDP print of -32%. To put that in context, during the Great Depression of the 1930s, global GDP was -15%. Consensus for Q3 is now +18%, a number that has continued to climb, prompting discussions of a V-shaped recovery. It is important to note these are very fluid numbers and can change quickly if states roll back or halt current re-opening plans.
The Elephant in the Room - U.S. Treasury Yield Curve

Given the above, the obvious question is: Why is the market within earshot of going positive for 2020? The elephant in the room is of course the Federal Reserve. Yes, there has been massive fiscal stimulus, but current monetary policy has effectively murdered the traditional 60-40 portfolio. By anchoring the short end of the curve at zero, three-year paper offers just 18 basis points and the 10 year is at only 67 bps. To make more than 1% annually, you have to extend almost 20 years.
Yield Spread Volatility

This dynamic has forced more and more capital into equity markets where the dividend yield of the S&P 500 (+1.91%) is significantly more attractive. The lowest rung of investment grade corporate bonds can give you about 1% more than a comparable Treasury but still doesn't equal the potential of the equity market. The spike in the yield spread from March to April this year indicates just how volatile even this safe haven was during the early stages of the pandemic.

In this backdrop yield starved investors often turn to high yield debt, which in times of market stress has the same characteristics as equity. While the peak-to-trough downturn in high yield offered a little more protection than large cap stocks, total return performance vs the S&P 500 for 1 year, 5 years and 10 years pales in comparison.
Today, tactical equity and structured notes are just two of the tools used to offset equity risk for the traditional balanced investor. Putting it in this context it is easy to see why valuations have been pushed to the highest levels since 2001.
If you're looking for a barometer to measure how good or bad the recovery is doing, look to the relationship between cyclical and secular growth. Investors continue to rush from one side of the lifeboat to the other looking for the perceived safe haven.
Large cap secular growth made the most sense at the beginning of the crisis and is the long-term secular winner but, as the recovery continues, industrials, energy and even financials deserve a place in your portfolio.
Global PMI data is improving
All the data last week was better than expected except for the Chicago PMI which came in weak because of one company. Boeing had significantly more cancellations than orders including a massive cancellation of 100 planes by a single customer.
What I don't like
I cannot get my arms around close proximity businesses. Theme parks, big box retail and, of course, restaurants. Even if you have a business model that can adjust to a post-COVID world, if you are processing fewer customers and/or product in a given day, that translates into less revenue.
What do the charts say
Biggest short-term risk is the June 11th gap down early last month that we have discussed several times since. The island reversal still is in play as stocks have yet to close the gap or confirm with a close below the June 11th low. (Futures this morning are setting up to close that gap.) Stocks have continued to trade in a tight range bouncing off the latest headlines.
Another Brick in the Wall
I think all of us agree the election will be the most divisive in a generation. Markets will adjust as they always do in the backdrop of an election year. I would expect sector volatility to increase with special attention to healthcare, energy and even big cap technology.
Election day has its own set of challenges for investors as absentee ballots are expected to be at record levels. We may not know for days perhaps even weeks who will be sitting in the White House in 2021. The above supports an elevated VIX (CBOE Market Volatility Index) at least through year's end, adding more than a few bricks to the market's wall of worry.
Related: Is the Economic Recovery at Risk?