
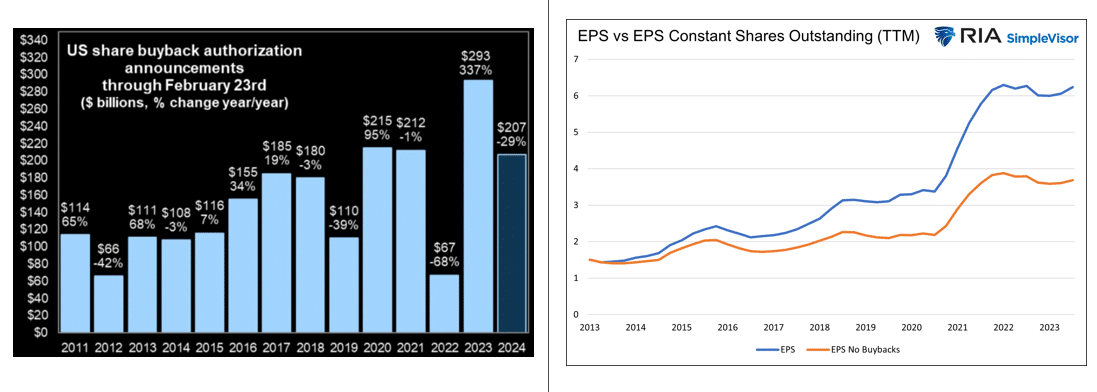
Stock buyback authorization announcements are soaring this year. As shown in the graph on the left, the $207 billion in 2024 stock buyback announcements is already on par with the annual totals for 2020 and 2021 and only 29% behind the record-setting $293 billion last year. Mind you, there are still ten months to go in 2024. Stock buybacks provide a tailwind for the market. Not only does a company that buys back its stock reduce the supply of its shares, but in doing so, it increases its earnings per share. Earnings don’t change, but the denominator, the number of shares, declines.
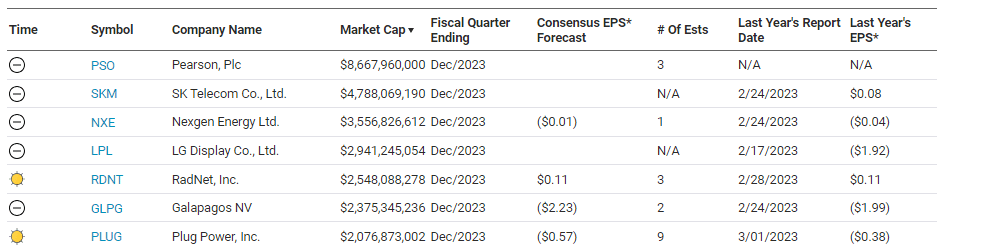
Our latest article, Apple’s Magic, reviews Apple. In particular, it shows how Apple’s earnings growth does not support its high valuations. Instead, stock buybacks are the culprit behind its high valuations. The graph to the right shows Apple’s EPS as reported and if they had not repurchased shares. Assuming the P/E were to remain at current levels had they not bought back shares, Apple’s share price would be nearly 50% less than it currently is! “Unlike most “growth” companies, a bet on Apple is a bet on their ability to buy back shares.” Indeed, our analysis shows Apple can keep up its buyback magic.
What To Watch Today
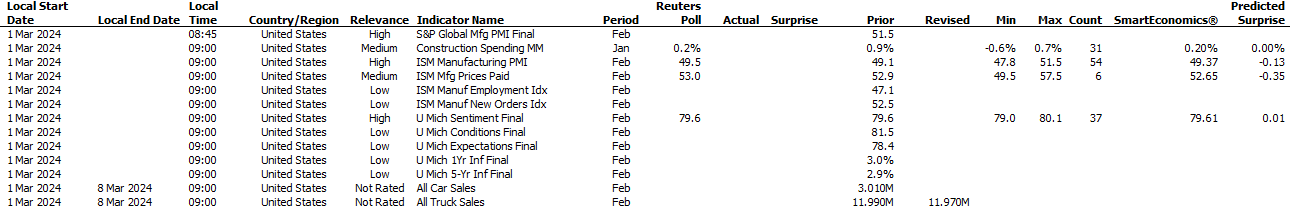
Earnings
Economy
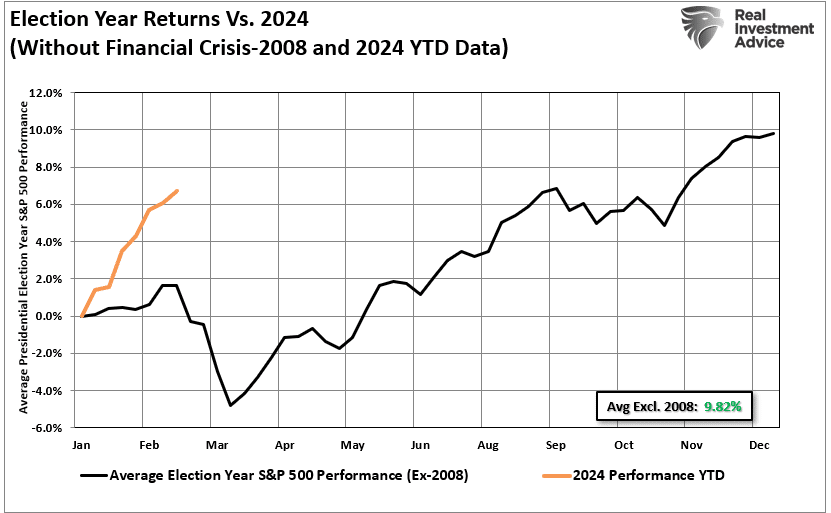
Market Trading Update
As we end the month of February and enter into March, a look at the average return cycle of Presidential election years suggests some near-term weakness is likely. With the market already off to a ferocious start to begin the year, a respite seems likely before the remainder of the seasonality into summer. It is worth noting that in the two months prior to the election, weakness also sets in as markets tend to derisk ahead of the election. With this year’s contest set to be contentious and with a risk of social unrest as well, some derisking will likely be warranted.
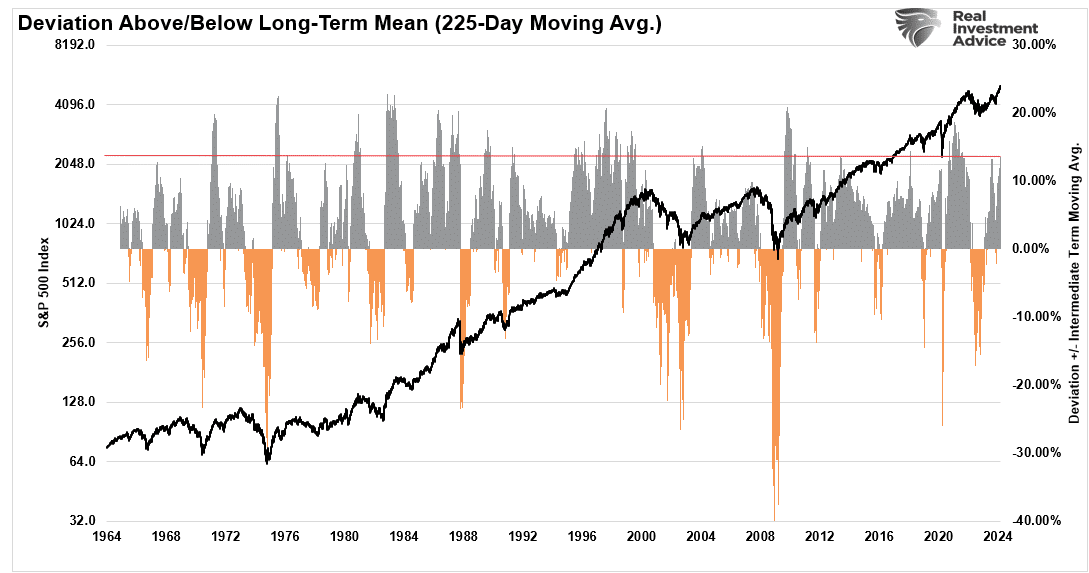
However, another reason we continue to expect some corrective actions soon is the more extreme deviation from the 225-day moving average. While these deviations can last for quite some time, they always eventually revert.
The same is evident with the current deviation from the 1-year moving average as well. These more extreme deviations are unsustainable.
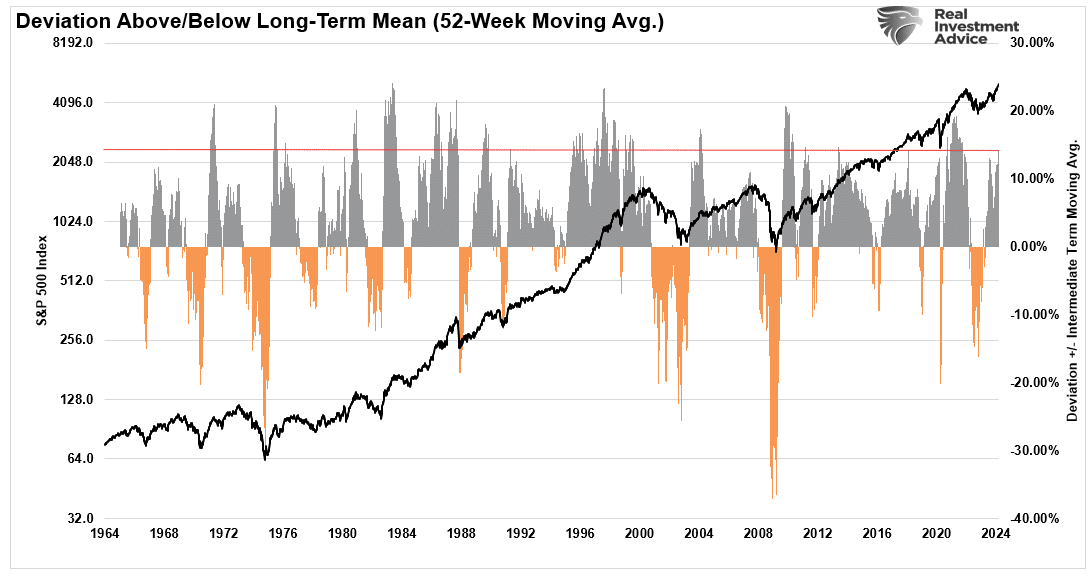
We have no idea what will trigger such a reversion or how soon it will occur. However, there is no outcome where one doesn’t eventually occur. As such, we continue to suggest rebalancing risk as needed.
Sector Dominance- Is Technology The New Railroads?
The financial media, ourselves included, are making much ado about the prominence of the Magnificent Seven and the Tech Sector. As we share below, such dominance by one sector or small group of stocks is not new. Furthermore, it’s not just a U.S. phenomenon.
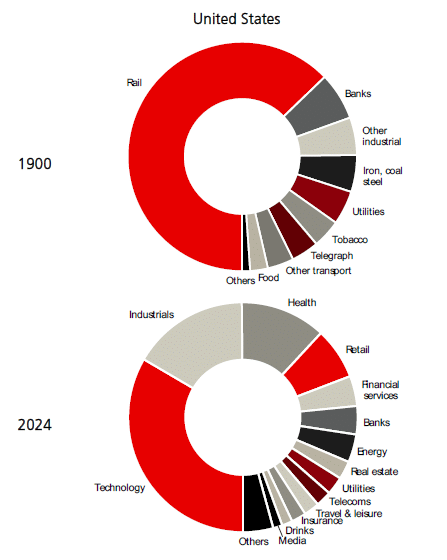
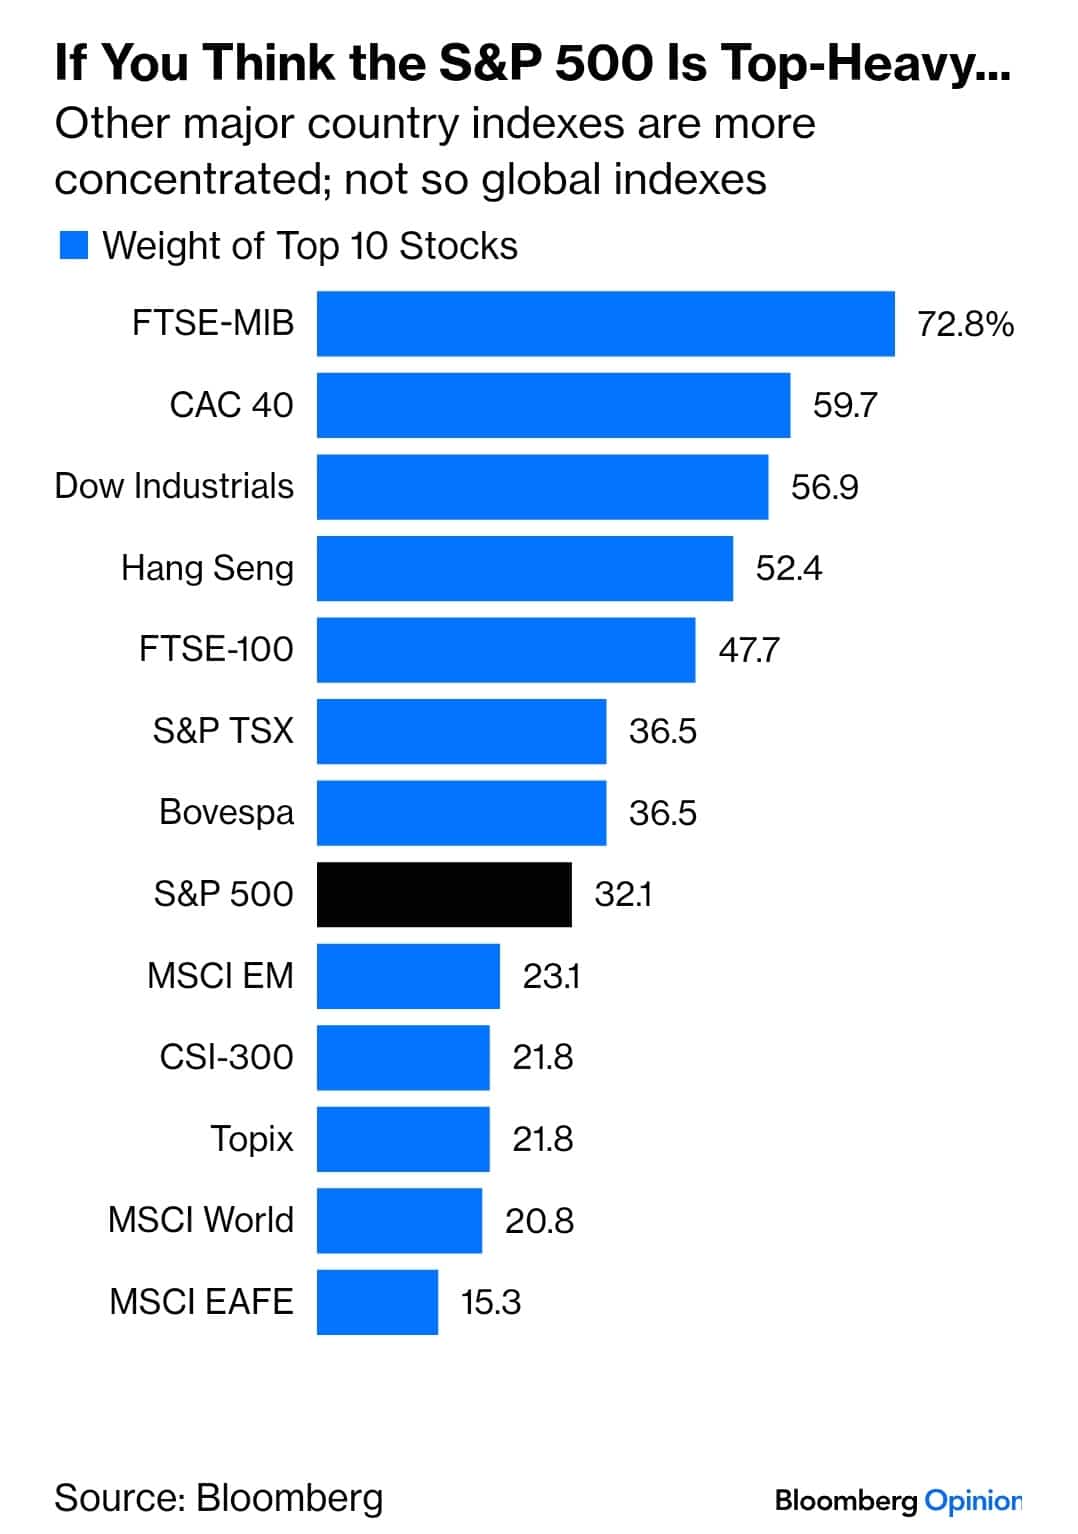
The pie charts below show that in 1900, railroad stocks accounted for about two-thirds of the market. It’s funny to consider today, but railroads were the latest technology. Today, the markets are heavily skewed toward technology stocks but much less so than railroad stocks in 1900. The second graph below shows that many other global indexes are more heavily concentrated than the S&P 500. However, it’s worth disclaiming that many of those indexes have far fewer stocks than the S&P 500. For instance, the French CAC 40 has 40 stocks. Therefore, the top ten represent 25% of the index on an equal-weighted basis. Conversely, the top ten of the S&P 500 only represent 2% of the index.
PCE Inflation, Income, And Spending
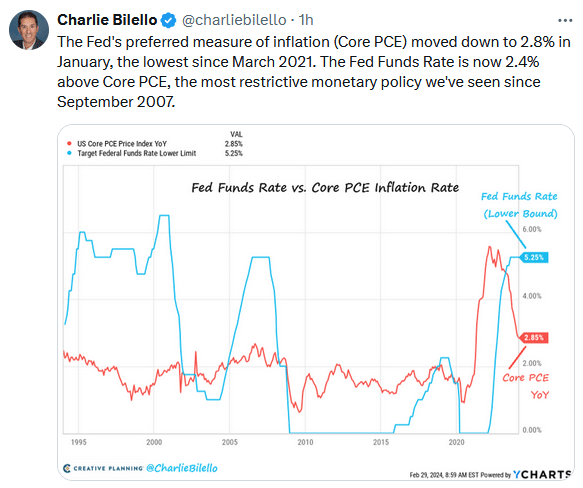
Monthly PCE prices were up 0.3% in January, in line with expectations, but 0.2% higher than in December. December was revised lower by 0.1%. Core PCE prices rose 0.4% monthly and 2.8% annually. The data, like CPI and PPI, point to prices settling in around 3% inflation. Before assuming inflation is sticky, we would like to see a few more months of inflation data, as seasonal behaviors and adjustments can warp data this time of year.
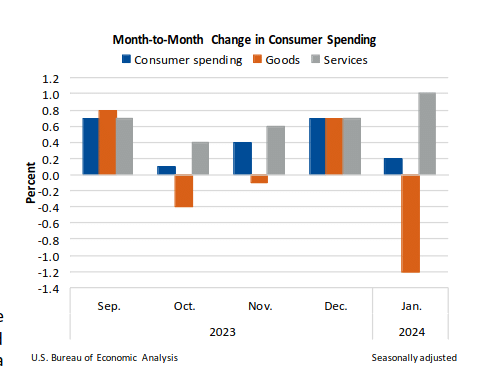
Personal spending and income data showed a few interesting divergences. For example, personal incomes rose by a hefty 1%, yet spending was only +0.2%. Real spending was slightly negative (-0.1%), the lowest level in six months. Are consumers starting to save more, or are seasonal factors responsible? Dividend income was a large contributor to personal income. The graph below shows another odd divergence. Spending on services rose at its quickest pace in at least four months while goods spending fell sharply. Declining auto sales help explain some of the decline in goods. Housing, utilities, financial services, and insurance boosted service spending. To reiterate, be careful of season effects and adjustments to data.
Tweet of the Day
“Want to have better long-term success in managing your portfolio? Here are our 15-trading rules for managing market risks.”