
Written by: Adam Schrier | New York Life Investments
The decision to extend duration or stay short has proven to be quite difficult over the past 18 months. The 10-year Treasury yield seemed to have peaked numerous times, only to bounce back sharply and surpass the previous peak. This led to heightened volatility in more rate-sensitive asset classes like core bonds, which were up by over 4% earlier this year, but have since declined, and are now down 1.2% year to date through September.
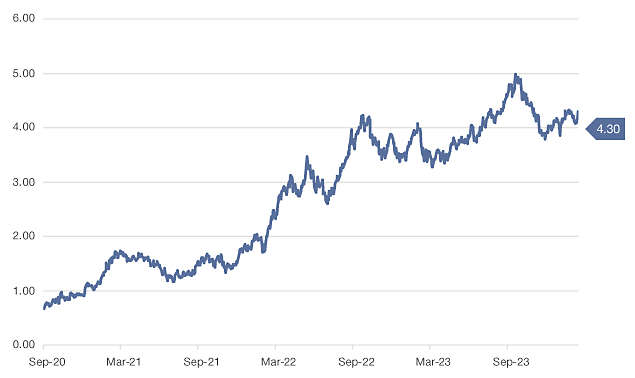
Source: FactSet 9/30/2020 – 9/30/2023 Past performance is no guarantee of future results, which will vary.
Despite the upward trajectory of U.S. Treasuries, investors poured money into longer-duration fixed income, confident that rates would soon fall. Through August, Intermediate Core Bond, Intermediate-Core Plus Bond, and Long Government are the top three Morningstar category flow leaders this year. On the other hand, Short-Term Bond and Bank Loans, categories with very limited duration, are the top two fixed-income category outflow leaders.
However, rates continued to rise, putting pressure on fixed-income prices. The chart below shows cumulative fund flows into the Morningstar Long Government category versus the performance of long government bonds over the last three years. This chart demonstrates how difficult it can be to time markets — and the penalty for being wrong. While this long-duration category saw massive inflows, long government bonds have declined almost 37% over the last three years, as of September 30, 2023.
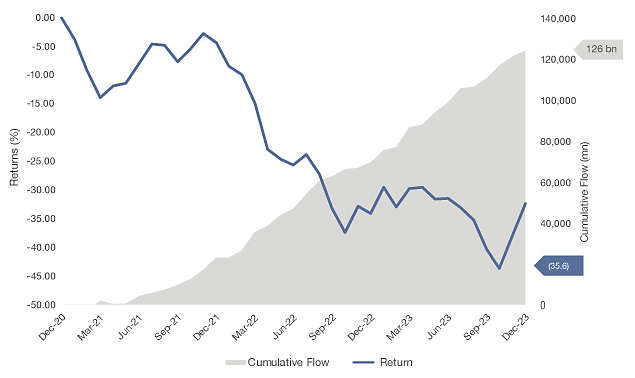
Source: FactSet, Morningstar 9/30/2020 – 9/30/2023. Flows are represented by the Morningstar Long Government category. Performance represented by the Bloomberg US Treasury (20+) Index. Past performance is no guarantee of future results, which will vary. It is not possible to invest directly in an index.
This highlights the importance of diversification in fixed income — with so many different potential outcomes, portfolios should be positioned so they are not dependent on one specific outcome to perform well. We believe one way of achieving diversification is by implementing a “credit/duration” barbell consisting of short-duration, non-investment-grade credit and higher-quality, investment-grade bonds.
For our example, we use a 50/50 blend of short-duration, high-yield and floating-rate loans to represent the credit component and core bonds for the high-quality duration component. Even though longer-duration core bonds are in the red this year, that is offset by the credit exposure of the barbell. Short-duration credit is more sensitive to corporate fundamentals, and given that floating-rate loan coupons are tied to the fed funds rate, this allocation has generated relatively high levels of income, while offering total return potential due to discounted prices. Historically, when credit experienced volatility, this coincided with falling rates, which had a positive impact on longer-duration, high-quality bonds. Paired together, short credit and longer duration have the potential to provide attractive, risk-adjusted returns.
An investor’s economic view and risk tolerance would determine how the barbell is weighted. Over the last five years, favoring credit has outperformed a more rate-sensitive barbell. However, the 100% credit portfolio had the deepest drawdown in 2020. An investor who wants to lengthen the duration and is more cautious on credit may tilt the allocation toward higher-quality, longer-duration bonds, while maintaining some credit exposure for diversification.
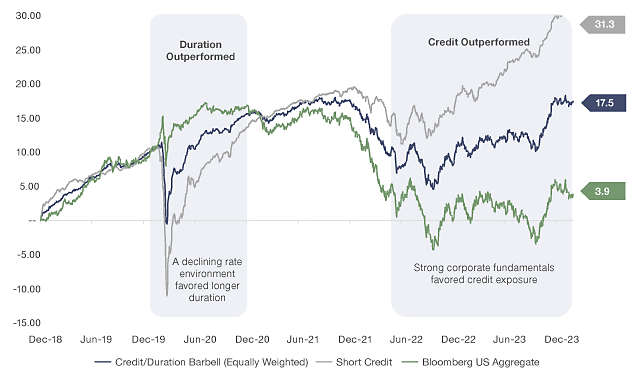
Source: FactSet, 9/30/2018 – 9/30/2023. Short Credit is represented by an equal weighted blend of ICE BofA US High Yield BB-B (1-5Y) and Morningstar LSTA Leveraged Loan Index. The Bloomberg U.S. Aggregate Bond Index is a broad-based benchmark that measures the Investment Grade, U.S. dollar-denominated, fixed-rate taxable bond market. It is not possible to invest directly in an index. Past performance does not guarantee future results.
Most notably, the 100% US Aggregate portfolio has not had the lowest volatility (as measured by standard deviation) over the five years, or other time periods for that matter. Across all time periods shown in the chart below, adding short-duration credit to a core bond allocation has reduced portfolio risk. The reverse is also true. In all time periods, with the exception of the three-year, a 100% short credit portfolio had the highest volatility, and even just a one-third weighting to core bonds greatly reduced risk.
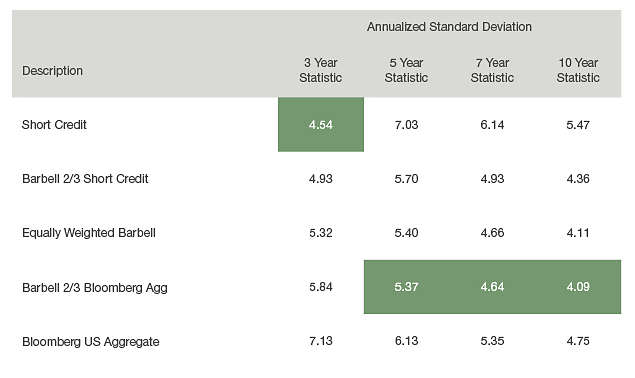
Source: FactSet. As of 9/30/23. Standard deviation is a statistic that measures the dispersion of a dataset relative to its mean and is calculated as the square root of the variance. Short Credit is represented by an equal weighted blend of ICE BofA US High Yield BB-B (1-5Y) and Morningstar LSTA Leveraged Loan Index. The Bloomberg U.S. Aggregate Bond Index is a broad-based benchmark that measures the investment-grade, U.S. dollar-denominated, fixed-rate, taxable bond market. It is not possible to invest directly in an index. Past performance does not guarantee future results.
At some point, we feel it is reasonable to believe that longer-duration fixed income will perform well. Figuring out when that exact point will be is much harder to predict. By constructing a diversified fixed-income portfolio, the need to predict specific outcomes at precise times becomes less important. The credit/duration barbell may be an attractive solution for investors who want to build a more resilient portfolio without having to perfectly time markets. There is a case to be made for credit, given fundamentals, relatively high yields and low dollar prices. As Treasury yields rise, it becomes more apparent that high-quality duration makes sense as well. By pairing both credit and rate-sensitive fixed income in a credit/duration barbell, an investor can have a view on the economy and markets but also not need to depend on that view to be entirely correct to have a positive outcome.