
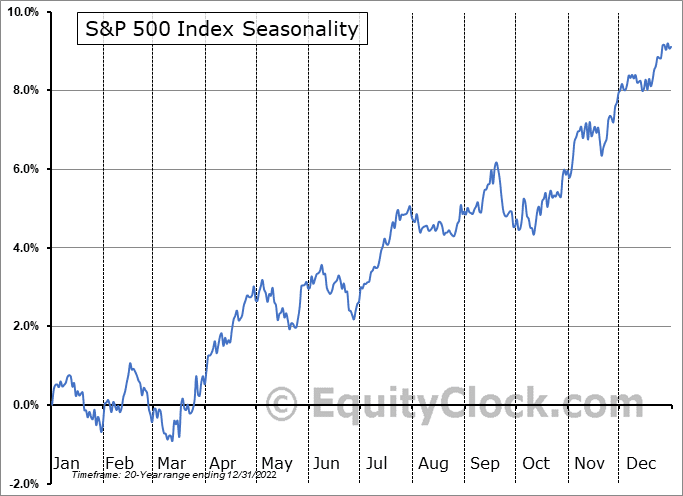
While September has been a bit sloppy so far, will further weakness in October weigh on investor sentiment before the seasonally strong period begins? As shown by the S&P 500 index seasonality chart below, weakness in the last two weeks of September and the first two weeks of October is common. However, we must also understand that the big down move in the market during that period came from historical crashes such as the “Financial Crisis” in 2008. Excluding those periods, the market still tends to be weak but more flat in nature.
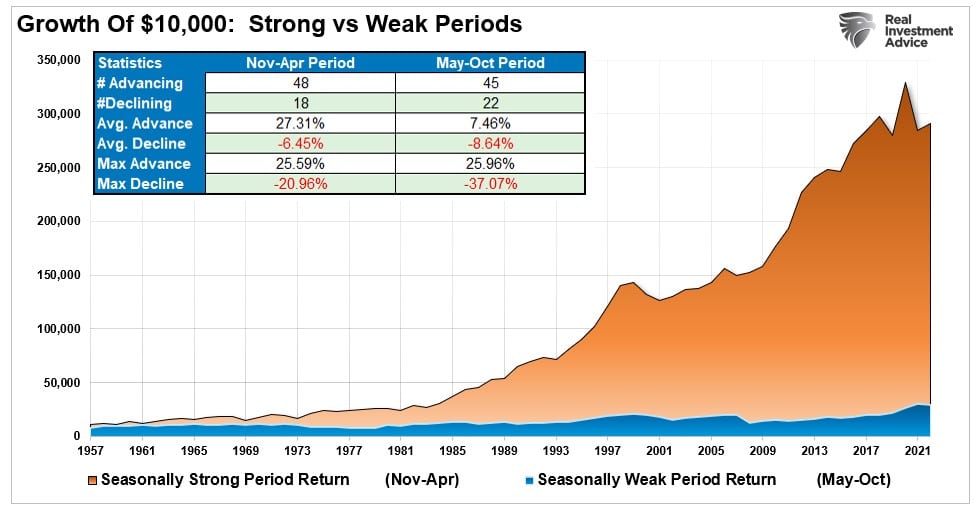
Just as a reminder, the historical analysis suggests summer months of the market tend to be the weakest of the year. The mathematical statistics prove this as $10,000 invested in the market from November to April vastly outperformed the same amount invested from May through October. Interestingly, the max drawdowns are significantly larger during the “Sell In May” periods. Previous important dates of major market declines occurred in October 1929, 1987, and 2008.
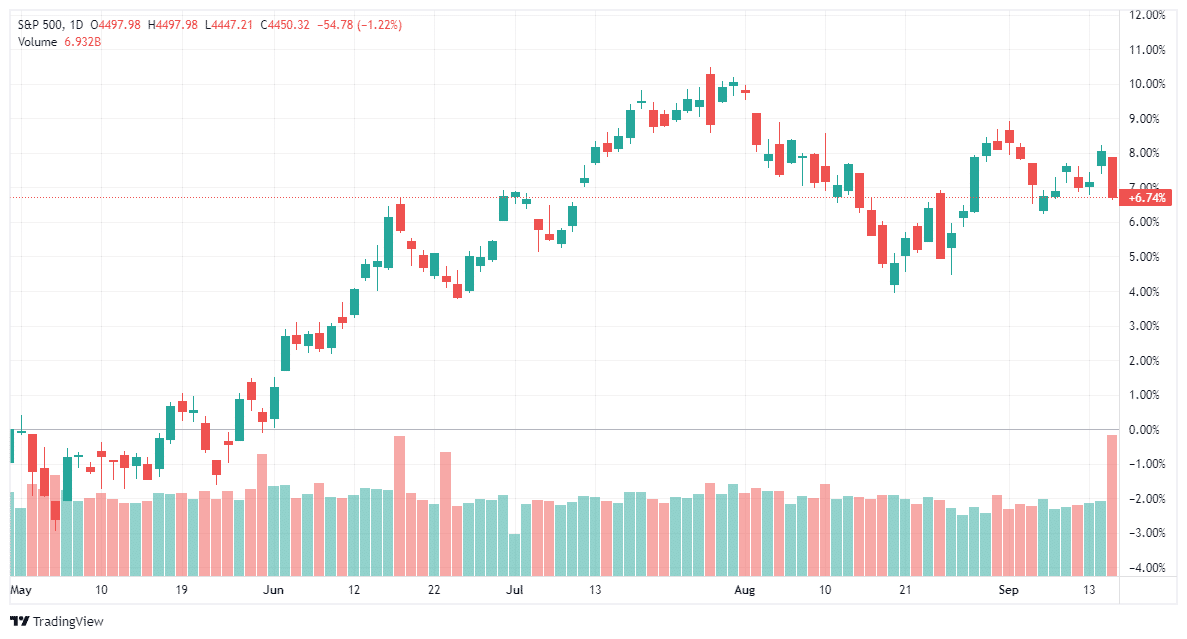
So far this year, the May through October period remains about average, with a return through last Friday of 6.74%. Even if there is some additional weakness, the overall period should still be a “win” for investors. However, as noted, the weakness came a bit late this year, with a 5%ish correction starting in August.
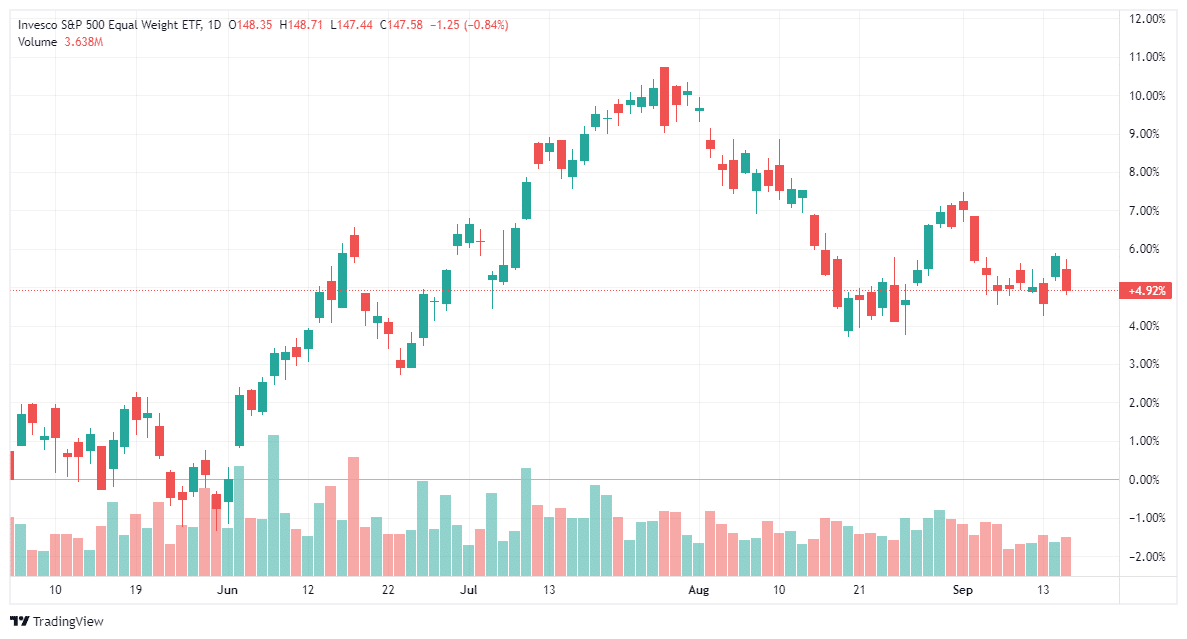
However, this is a bit deceiving. As we noted previously, much of the gain in the market this year has come from essentially ten stocks that have the largest concentration, in terms of market capitalization, in the index. The surge in those stocks has skewed the performance of the broad market index. The performance of the bottom 490 stocks remains markedly different.
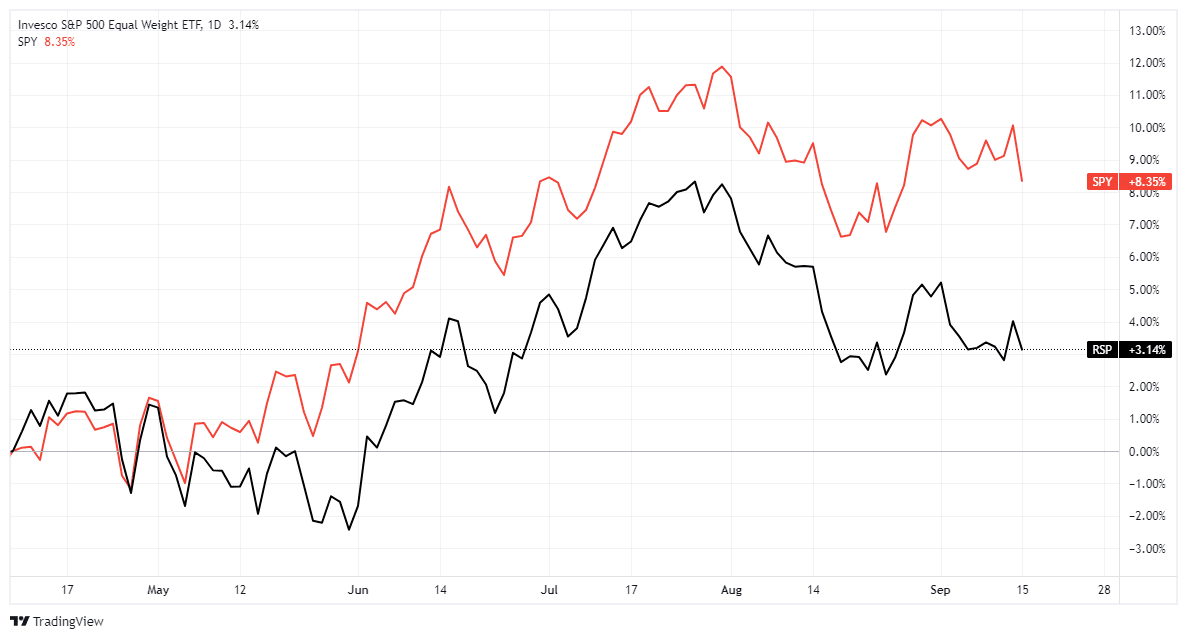
Looking at the performance of the equal-weighted index from May to the present, we see the seasonal market weakness more clearly. While still positive, the return so far is about 200 basis points weaker.
So, as we begin to wrap up the seasonally weak period for stocks, what will potentially be the market drivers into year-end as the seasonally strong period begins?
Driving Ms. Daisy
Three primary drivers will likely drive markets from the middle of October through year-end.
The first is earnings season, which kicks off in two weeks. As is always the case, analysts have significantly lowered the “earnings bar” heading into reporting season. As noted in “Trojan Horses,” analysts are always wrong, and by a large degree.
“This is why we call it ‘Millennial Earnings Season.’ Wall Street continuously lowers estimates as the reporting period approaches so ‘everyone gets a trophy.’”
The chart below shows the changes in Q3 earnings estimates from February 2022, when analysts provided their first estimates.
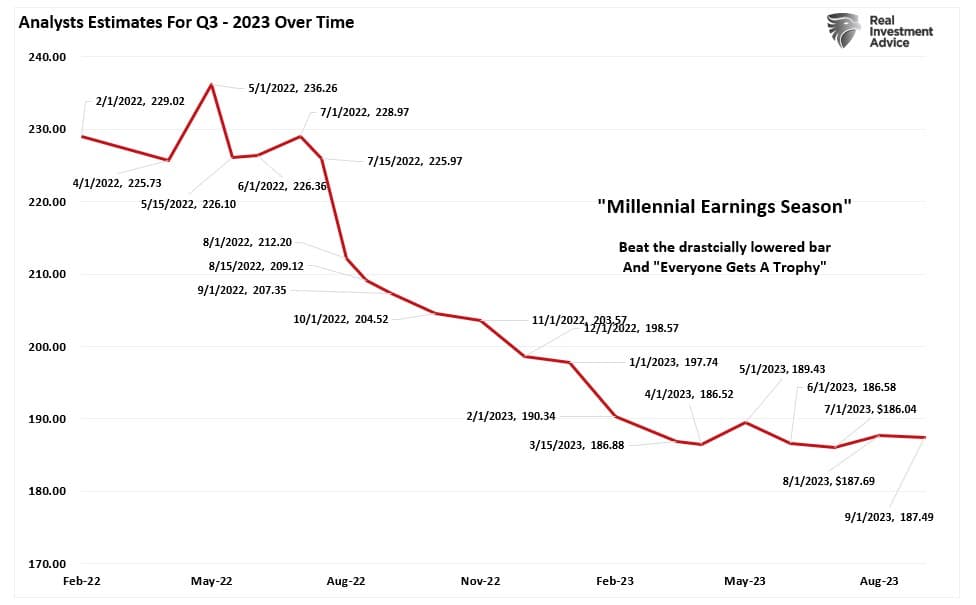
Of course, with the bar lowered, such will generate a high “beat rate” by companies, which will help fuel stock prices in the short term. Notably, those “high beat rates” get support from the more negative short-term sentiment and reduced equity allocations by professional managers during the summer. As stocks start to move higher, professional managers will begin to chase performance, pushing prices higher.
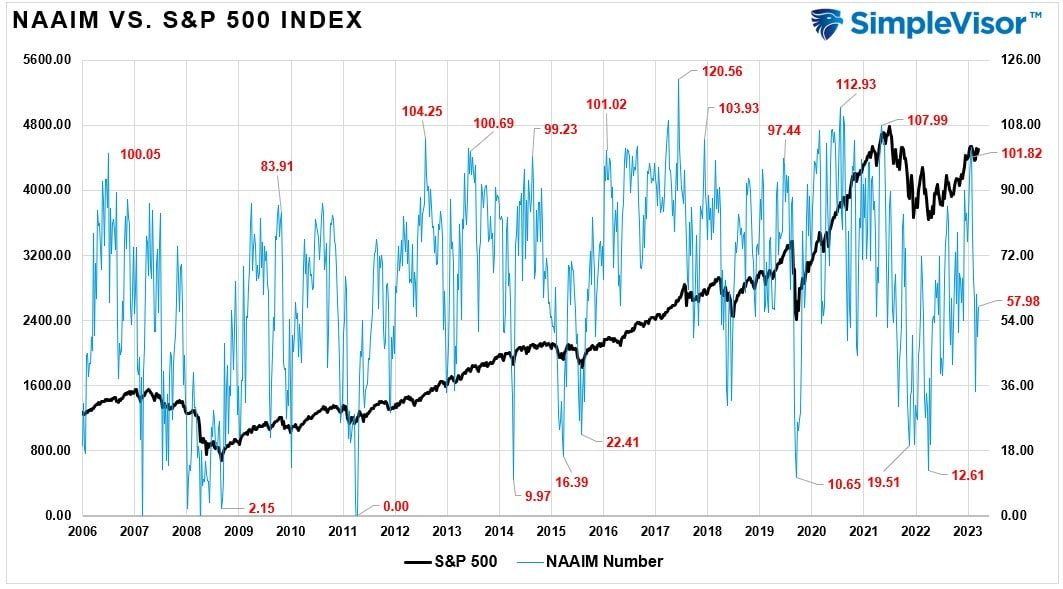
Given the large divergence between the market and equal-weighted indices this year, there is additional pressure on managers to “catch up” with performance moving into year-end reporting. Given the “career risk” to managers of significant underperformance, additional buying pressure could manifest.
Lastly, corporate share buyback windows will reopen in November and December as companies exit their earnings “blackout period.” Notably, as shown in the table below, the last two months of the year represent the best two-month period of the year for corporate executions. Such is because corporations have a clear picture of their current financial positions and can use stored cash to execute buybacks. As noted by Goldman Sachs:
“The VWAP machines will be lining up to buy $5bn worth of equities daily during November and December.”
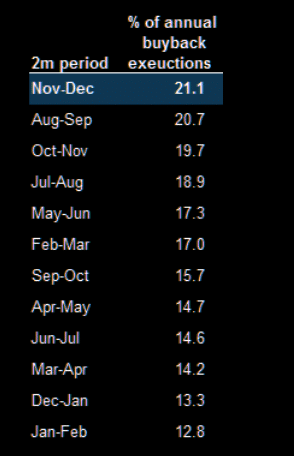
Yes, that is $5 billion each trading day, which provides sufficient buying power to lift asset prices into year-end.
Don’t Forget About The Risks
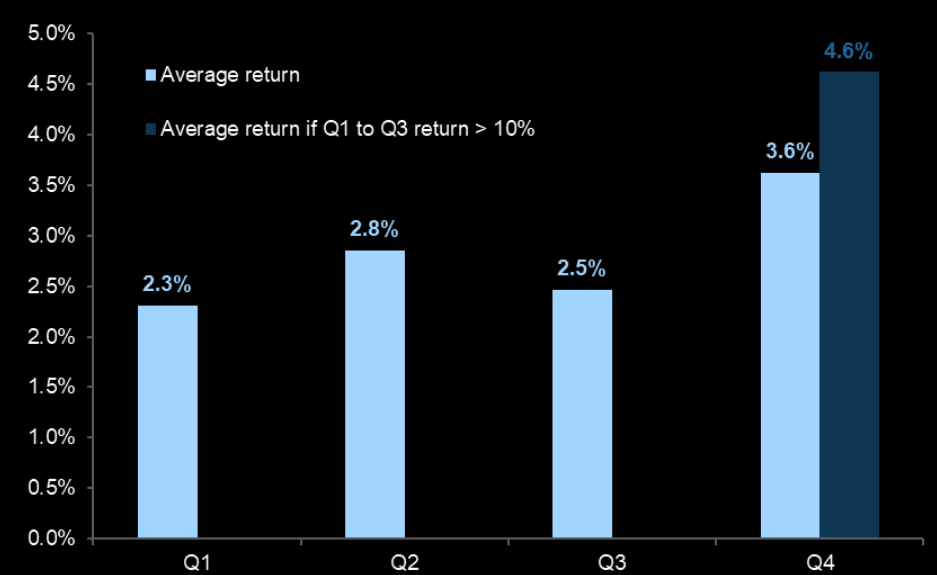
A reasonable backdrop between the summer selloff, sentiment, positioning, and buybacks suggests a push higher by year-end. Add to that the performance chase by portfolio managers as they buy stocks for year-end reporting purposes. As Goldman’s flow guru Scott Rubner points out:
“Since 1900, the average Q4 return for SPX when the market returns for the first three quarters of the year were greater than 10%, fourth quarter returns were stronger than average coming in at 4.6%.”
While the backdrop certainly supports a rally into year-end, such is not guaranteed. However, the potential risk of elevated interest rates, slowing economic data, and tighter financial conditions should not be dismissed.
One of the things we continue to keep a very close watch on is the extremely suppressed level of market volatility. While the markets are indeed acting bullishly, extremely low levels of volatility are a warning. As shown below, previous periods of low volatility eventually led to periods of higher volatility.
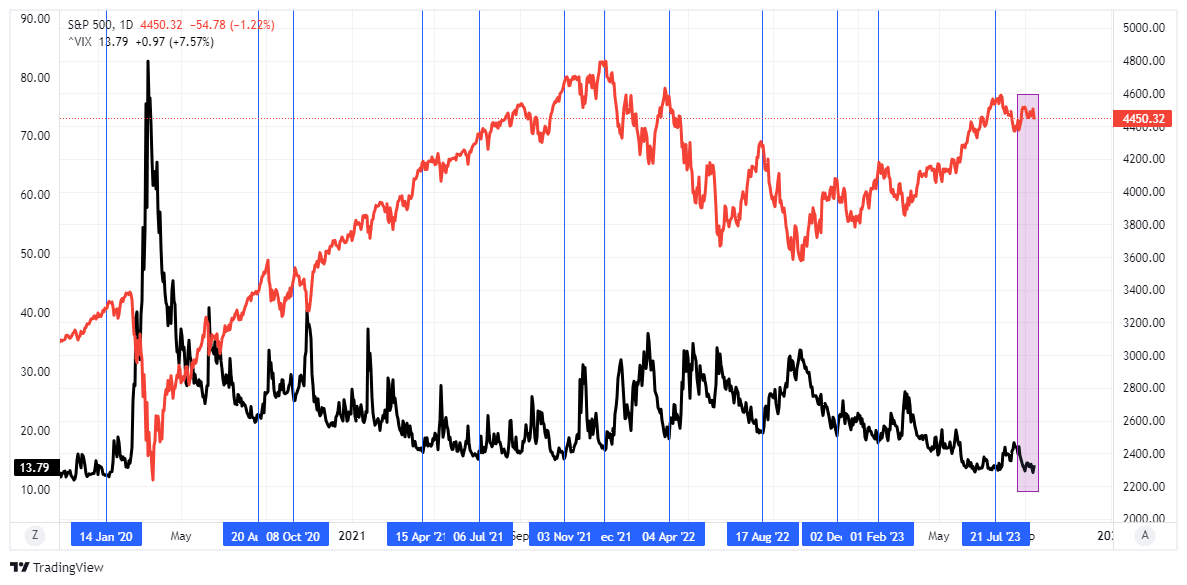
While such low levels of volatility can certainly last longer than many expect, it is inevitable that, eventually, we will have a reversal. When that will happen, or what will cause it, is always unknown, but such a reversal is almost assured.
For now, an ongoing bullish bias continues to support the market near-term. Bull markets built on “momentum” are very hard to kill. Warning signs can last longer than logic would predict. The risk comes when investors begin to “discount” the warnings and assume they are wrong by suggesting “this time is different.”
There is little to lose by paying attention to “risk.”
If warning signs prove incorrect, removing hedges and reallocating into equity risk is simple.
However, if warning signs come to fruition, a more conservative stance in portfolios will protect capital in the short term. Reducing volatility allows for a logical approach to making further adjustments as the correction becomes more apparent. (The goal is not to be forced into a “panic selling” situation.)
It also allows you the opportunity to follow the “Golden Investment Rule:”
“Buy low and sell high.”