
Written by: Jan van Eck
China has been a major contributor to global growth, and its economic activity tends to have significant repercussions for the global economy. To understand where the Chinese economy is in its growth cycle, we highlight a few key charts below, which may also provide context for the impact of the coronavirus.
Chinese Economy Health Check: PMIs
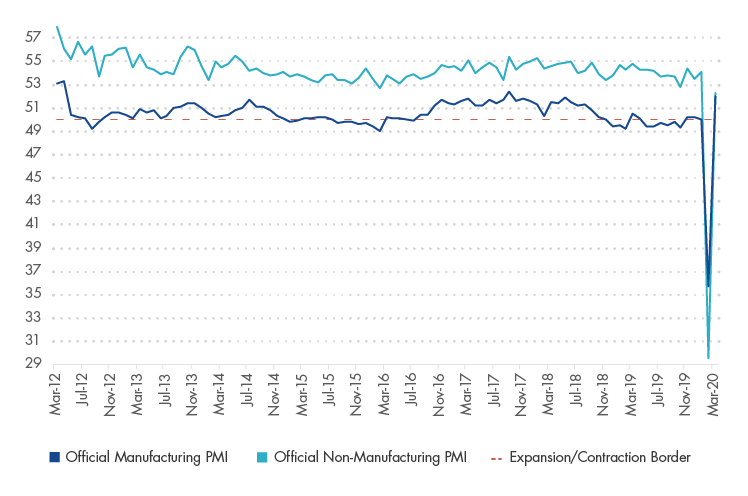
Bloomberg. Data as of March 31, 2020. Past performance is no guarantee of future results. Chart is for illustrative purposes only.
We believe purchasing managers’ indices (PMIs)1 are a better indicator of the health of the Chinese economy than the gross domestic product (GDP) number, which is politicized and is a composite in any case. The manufacturing and non-manufacturing, or service, PMIs have been separated in order to understand the different sectors of the economy. These days, the manufacturing PMI is the number to watch for cyclicality.
China’s official activity gauges staged, in our view, an impressive comeback in March. The manufacturing PMI jumped from 35.7 to 52.0, and the services PMI from 29.6 to 52.3. The move echoes a similarly impressive move in the emerging industries PMI that was released earlier this month. Domestic activity is definitely picking up, but it is important to interpret these numbers correctly. PMI surveys usually ask to evaluate activities and expectations relative to the previous month. Against this backdrop, the surge to above-50 in March is not that surprising (due to February’s collapse). It does not, however, signal that growth returned to normal. It is rather an indication that domestic activity is rebounding from a very low base (which is still great).
This is why we think that China’s high-frequency indicators provide a more accurate picture of what is happening on the ground—both in terms of levels and direction. One of the most popular ones is the daily coal consumption by six major electricity producers, which have now reached about 90% of the level of the past three years. Other widely used indicators are the traffic congestion index for 100 cities and real estate transactions, both of which are now above 90% of the level seen during the same period in 2019. To sum up, the rebound is happening, but most sectors are still below their normal operating capacities.
There are also concerns that second-round effects emerging (both global and domestic) can slow or even reverse the process. These are the reasons why authorities lined up additional policy stimulus to make sure that recovery could continue uninterrupted. On the monetary side, the People’s Bank of China (PBoC) resumed easing, lowering its 7-day reverse repo rate by 20bps. The move revived expectations for equally sizable cuts in the medium-term lending facility (MLF) rate and the benchmark deposit rate. On the fiscal side, the recent Politburo meeting gave the green light to a larger budget deficit, as well as the issuance of special Treasury bonds and a larger quota of local government special bonds. It also called for lower effective loan rates—relatively high funding costs is a major headwind for smaller and privately-owned companies, so any progress in this area would be most welcome in our view.
Understanding the Credit Cycle: Non-SOE Borrowing Costs
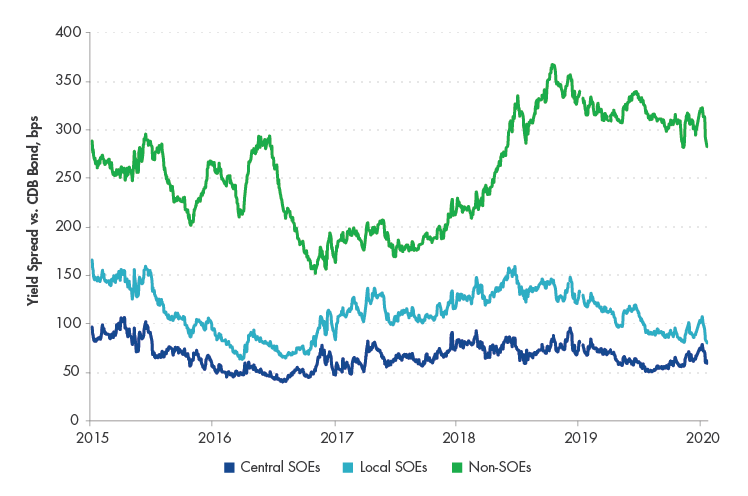
Source: UBS. Data as of February 25, 2020. Past performance is no guarantee of future results. Chart is for illustrative purposes only. Spreads are measured relative to average yield of 1, 3, 5, and 10 year bonds issued by the China Development Bank.
As with any economy, central bank policy is very important in China. In this chart, we can see that interest rates for the private sector fluctuate, whereas the interest rates paid by state-owned enterprises (SOEs) are pretty stable. Therefore, to understand the credit cycle, we point your attention to this private sector, or non-SOE, interest rate. It spiked in 2018, as a result of China’s crackdown on shadow banking2, meaning tougher lending conditions for the private sector. These interest rates began trending down in the winter of 2018 as the “drip stimulus” appeared to take effect.
Funding costs for China’s private companies remain high. We believe, part of the problem is that the transmission mechanism is not functioning properly, negating the impact of lower policy rates and reserve requirements. These companies were also disproportionately hit by the deleveraging drive. So, January’s policy reversal – shadow financing was up for the first time since March 2019 – was not particularly surprising in our view. It was also not surprising that the government has approved a special package (~0.6% of GDP in the form of lower social security payments) to help small and medium enterprises stay afloat.
Related: China First to Face Wave of Uncertainty
DISCLOSURE:The views and opinions expressed in this article are those of the contributor, and do not represent the views of Advisorpedia. Readers should not consider statements made by the contributor as formal recommendations and should consult their financial advisor before making any investment decisions. To read our full disclosure, please click here.