
Written by: Arkadiusz Sieroń, Ph.D.
On Thursday, the initial jobless claims rocketed to almost 3.3 million. Quite an unimaginable number. What does it imply for the US economy and the gold market?
One of the Most Scariest Things You Will See This Week
Would you like to see something scary? I guess not, but I'll show you anyway! But don’t worry: it will not be an microscope image of the coronavirus! Instead, I will present you a chart, a really scary chart… Ready to take a look?
Chart 1: US Initial Jobless Claims from January 7, 1967 to March 21, 20120

The chart above shows the number of US initial jobless claims. As you can see, the number of Americans who applied for unemployment benefits last week shot up to the moon! The initial jobless claims rocketed from 282,000 on March 15 to 3.28 million a week later! Yup, you read it correctly, to almost 3.3 million in just seven days! It means a rise of more than 3 million, or more than a tenfold increase, the highest in the history of this indicator!
Because the spike is so steep that the long-term chart may be not easily readable, we insert below the initial jobless claims over the last year. Still scary, huh?
Chart 2: US Initial Jobless Claims from March 23, 2019 to March 21, 20120
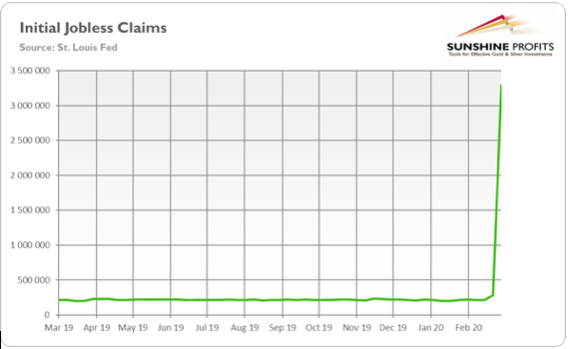
And do you know what is really frightening? The sudden surge in claims is likely just the beginning… You see, the data reported by the U.S. Department of Labor are released on Thursday, but they describe the situation from preceding Saturday. It means that when you read these words, the number of application for unemployment benefits has increased further along with the fresh waves of layoffs due to the social distancing and closure of nonessential businesses.
So, brace yourself for the surge in the unemployment rate in March and April! When we add all these new claims to the currently unemployed people (and assuming unchanged participation rate), the unemployment rate increases from 3.5 to 5.5 percent. But as we added just jobless claims from one week, you can expect the unemployment rate to rise quickly towards 10 percent, a Great Recession level, or even towards 20 percent, a level more associated with the Great Depression.
Indeed, the current shock to the global economy will likely be faster and more severe that the 2008 financial crisis or even the Great Depression. In those two previous episodes, stock markets also collapsed, credit markets froze up, massive bankruptcies followed, unemployment rates soared, while GDP contracted – but at a slower pace! All these took around a few years, not a few weeks, to play out!
Just take a look once again at Chart 1! As you can see, the number of initial jobless claims increased steadily from 344,000 in December 2007 to the peak of 665,000 in March 2009. So, it less than doubled over more than a year, while now it increased tenfold in one week! The pace and depth of the current shock is really unprecedented!
But it makes sense: even during the worst times of the economic crisis of 2008, the unemployment rate did not surpass 10 percent. It means that most of the labor force had jobs and worked more less as usual. The financial institutions were badly hit, which affected also households and the real economy, but the latter was not frozen. Now, the bulk of economic activity literally shut down. It did not happen even during the greatest recessions or during world wars when the production did not stop, but shifted towards military needs…
Implications for Gold
What does it all for the gold market? Well, given the scale of the current crisis and the monetary and fiscal stimulus to cushion the US economy, gold prices should go up. If not now, then when?
Even the Goldman Sachs believes that it is time to buy bullion. The Goldman team led by Jeffrey Currie wrote:
We have long argued that gold is the currency of last resort, acting as a hedge against currency debasement when policy makers act to accommodate shocks such as the one being experienced now.
Indeed, the price of gold has increased last week, as the chart below shows. However, gold’s performance is hardly an impressive bullish reaction to the COVID-19 crisis. But, as we explained before, this was caused by the massive sell-offs of panicked stock market investors who desperately needed cash. The current crisis has so far been deflationary – the oil prices plunged – and positive for the US dollar, which also created downward pressure on the gold prices.
Chart 3: Gold prices from January 2, to March 26, 2020.

But this can change soon. To be clear, gold prices may fall further on the way, as people during liquidity crises sell everything they can to obtain cash needed to run their companies or households. But fundamentals (negative real interest rates, risk aversion, rising public debt, unconventional easy monetary policy, etc.) should triumph eventually other factors and push gold prices up.
If you enjoyed today’s free gold report, we invite you to check out our premium services. We provide much more detailed fundamental analyses of the gold market in our monthly Gold Market Overview reports and we provide daily Gold & Silver Trading Alerts with clear buy and sell signals. In order to enjoy our gold analyses in their full scope, we invite you to subscribe today. If you’re not ready to subscribe yet though and are not on our gold mailing list yet, we urge you to sign up. It’s free and if you don’t like it, you can easily unsubscribe. Sign up today!
Related: The 11 Most Important Objectives the First Year as a Financial Advisor
Arkadiusz Sieron, PhD
Sunshine Profits – Effective Investments Through Diligence and Care
Disclaimer: Please note that the aim of the above analysis is to discuss the likely long-term impact of the featured phenomenon on the price of gold and this analysis does not indicate (nor does it aim to do so) whether gold is likely to move higher or lower in the short- or medium term. In order to determine the latter, many additional factors need to be considered (i.e. sentiment, chart patterns, cycles, indicators, ratios, self-similar patterns and more) and we are taking them into account (and discussing the short- and medium-term outlook) in our Trading Alerts.