
The hit TV series “That 70s Show” aired from 1998 to 2006 and focused on six teenage friends living in Wisconsin in the late 70s. The irony was that the actors playing the teenagers were not born in the late 70s and had never experienced life during that period. Many alive today cannot fathom a lifestyle devoid of the internet, cable television, mobile phones, and social media. Oh…the horrors.
Yet, today, almost 50 years later, financial commentators, many of whom were not alive at the time, suggest that inflation and yields will repeat “That 70s Show.” Understandably, the increase in inflation and interest rates from their historic lows is cause for concern. As James Bullard noted, “Inflation is a pernicious problem,” which is why the Federal Reserve lept into action.
“When the US Federal Reserve embarked on an aggressive campaign to quash inflation last year, it did so with the goal of avoiding a painful repeat of the 1970s, when inflation spun out of control and economic malaise set in.” – CNN
That concern of “spiraling inflation” remains the key concern of the Federal Reserve in its current monetary policy decisions. It has also pushed many economists to point back at history, using “That 70s Show” period as the yardstick for justifying their concerns about a resurgence of inflation.
“The chair of the Federal Reserve at the time, Arthur Burns, hiked interest rates dramatically between 1972 and 1974. Then, as the economy contracted, he changed course and started cutting rates.
Inflation later roared back, forcing the hand of Paul Volcker, who took over at the Fed in 1979, Richardson said. Volcker brought double-digit inflation to heel — but only by raising borrowing costs high enough to trigger back-to-back recessions in the early 1980s that at one point pushed unemployment above 10%.
‘If they don’t stop inflation now, the historical analogy [indicates] it’s not going to stop, and it’s going to get worse,’ said Richardson, an economics professor at the University of California, Irvine.”
However, such may be an oversimplification to suggest Burns was wrong and Volker was right. The reason is the economy today is vastly different than during “That 70s Show.”
Today Is Very Different Than The 1970s
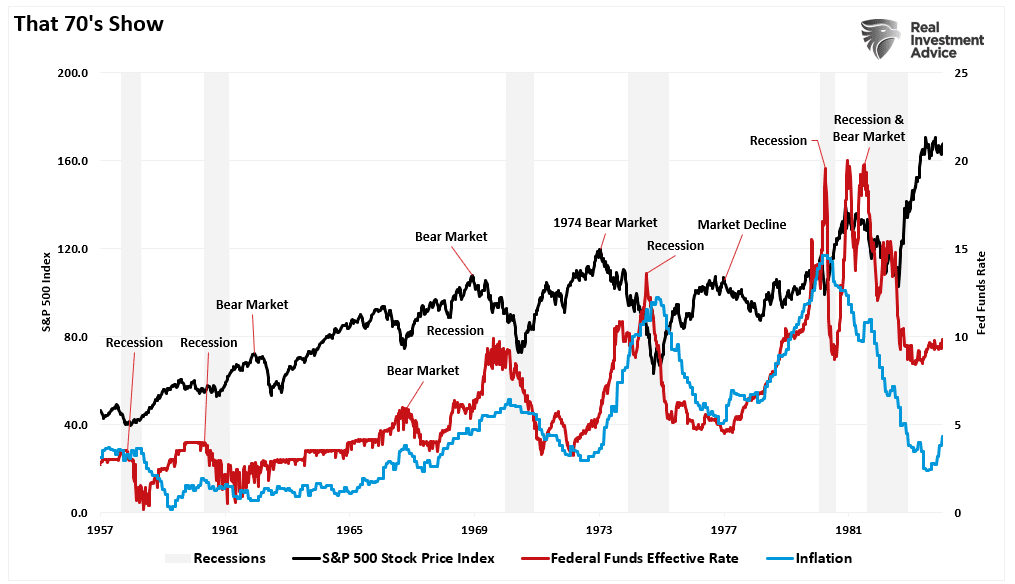
During the 70s, the Federal Reserve was entrenched in an inflation fight. The end of the Bretton Woods and the failure of wage/price controls combined with an oil embargo sent inflation surging. That surge sent markets crumbling under the weight of rising interest rates. Ongoing oil price shocks, spiking food costs, wages, and budgetary pressures led to stagflation through the end of that decade.
What was most notable was the Fed’s inflation fight. Like today, the Fed is hiking rates to quell inflationary pressures from exogenous factors. In the late 70s, the oil crisis led to inflationary pressures as oil prices fed through a manufacturing-intensive economy. Today, inflation resulted from monetary interventions that created demand against a supply-constrained economy.
Such is a critical point. During “That 70s Show,” the economy was primarily manufacturing-based, providing a high multiplier effect on economic growth. Today, the mix has reversed, with services making up the bulk of economic activity. While services are essential, they have a very low multiplier effect on economic activity.

One of the primary reasons is that services require lower wage growth than manufacturing.
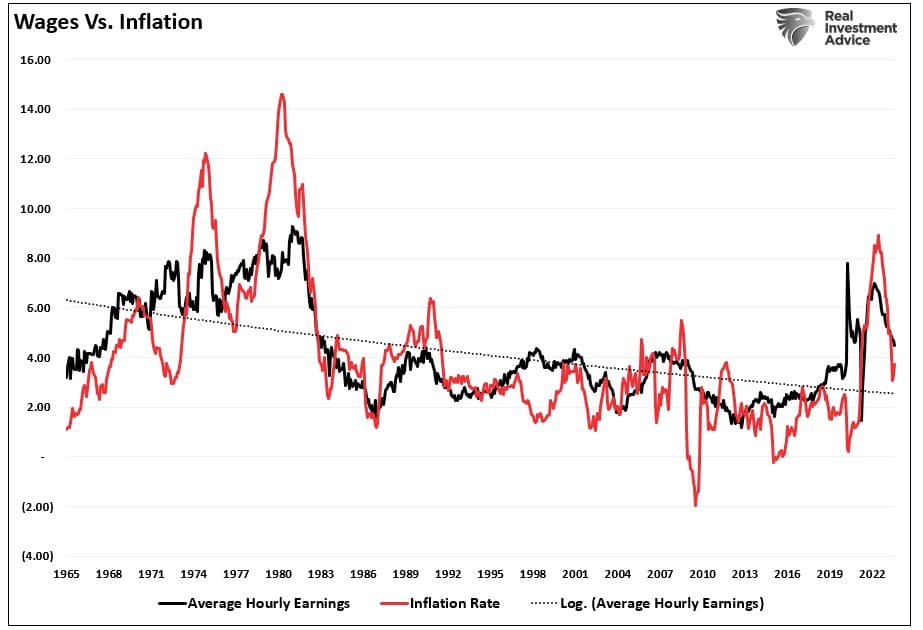
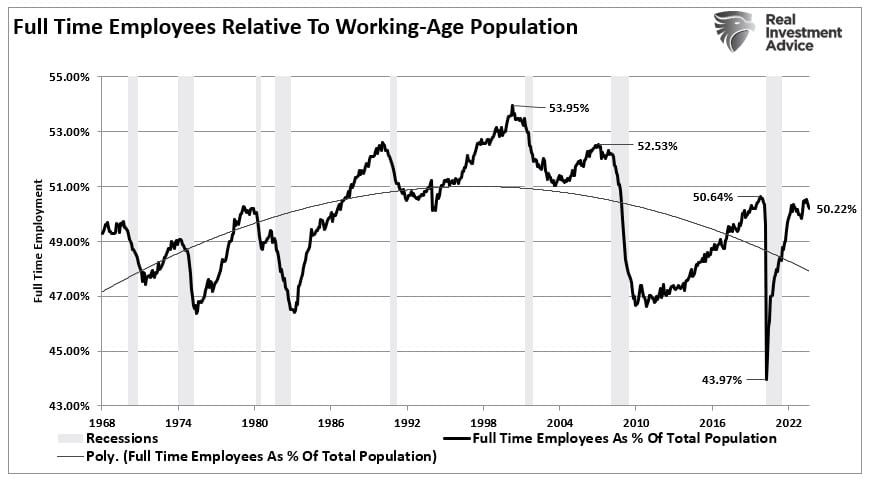
While wages did rise sharply over the last couple of years, such was a function of the economic shutdown, which created a supply/demand gap in the employment matrix. As shown, full-time employment as a percentage of the population fell sharply during the pandemic lockdown. However, with full employment back to pre-pandemic levels, wage growth declines as employers regain control over the labor balance.
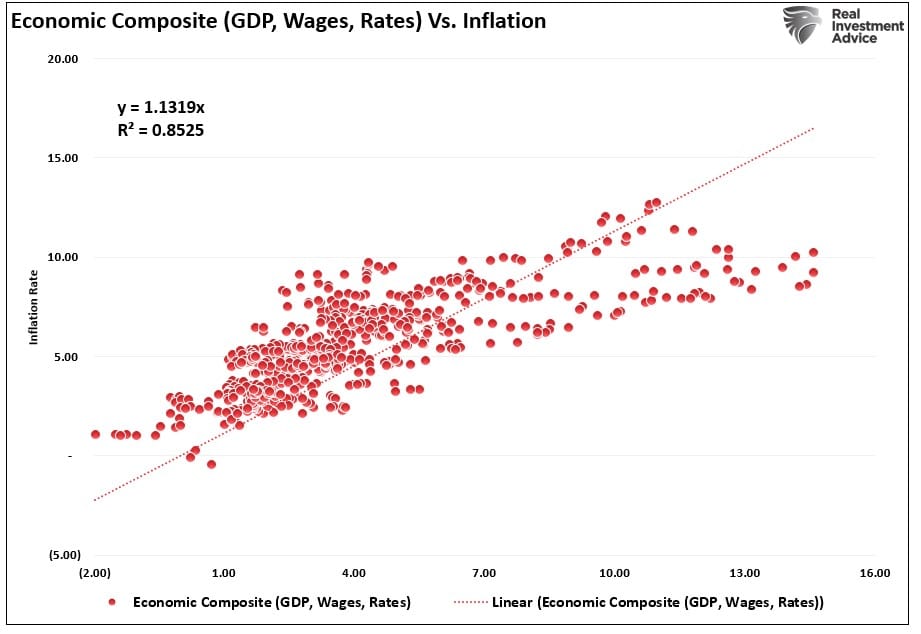
Furthermore, the economic composite of wages, interest rates, and economic growth remain highly correlated between “That 70s Show” and today. Such suggests that while inflation rose with the supply/demand imbalance created by the shutdown, the return to normalcy will lower inflation as economic activity slows.
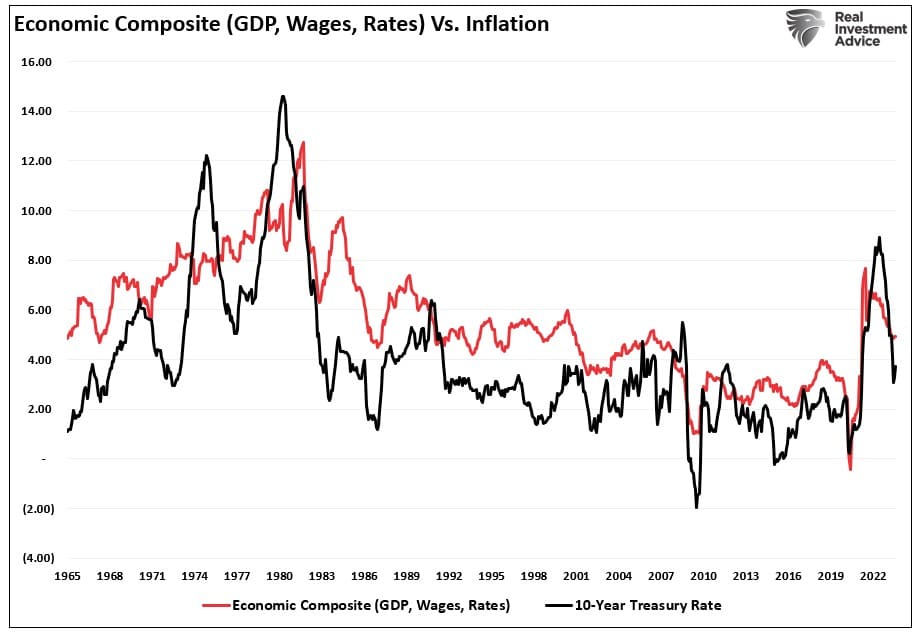
With a correlation of 85%, the inflationary decline will be coincident with economic growth, interest rates, and wages.
Unlike “That 70s Show,” where economic growth and wages were rising steadily, which allowed for higher levels of interest rates and inflation, There is a singular reason why a repeat of that period is quite impossible.
The Debt Burden And Economic Weakness
What is notable about “That 70s Show” is that it was the culmination of events following World War II.
Following World War II, America became the “last man standing.” France, England, Russia, Germany, Poland, Japan, and others were devastated, with little ability to produce for themselves. America found its most substantial economic growth as the “boys of war” returned home to start rebuilding a war-ravaged globe.
But that was just the start of it.
In the late ’50s, America stepped into the abyss as humankind took its first steps into space. The space race, which lasted nearly two decades, led to leaps in innovation and technology that paved the wave for the future of America.
These advances, combined with the industrial and manufacturing backdrop, fostered high levels of economic growth, increased savings rates, and capital investment, which supported higher interest rates.
Furthermore, the Government ran no deficit, and household debt to net worth was about 60%. So, while inflation increased and interest rates rose in tandem, the average household could sustain its living standard. The chart shows the difference between household debt versus incomes in the pre- and post-financialization eras.
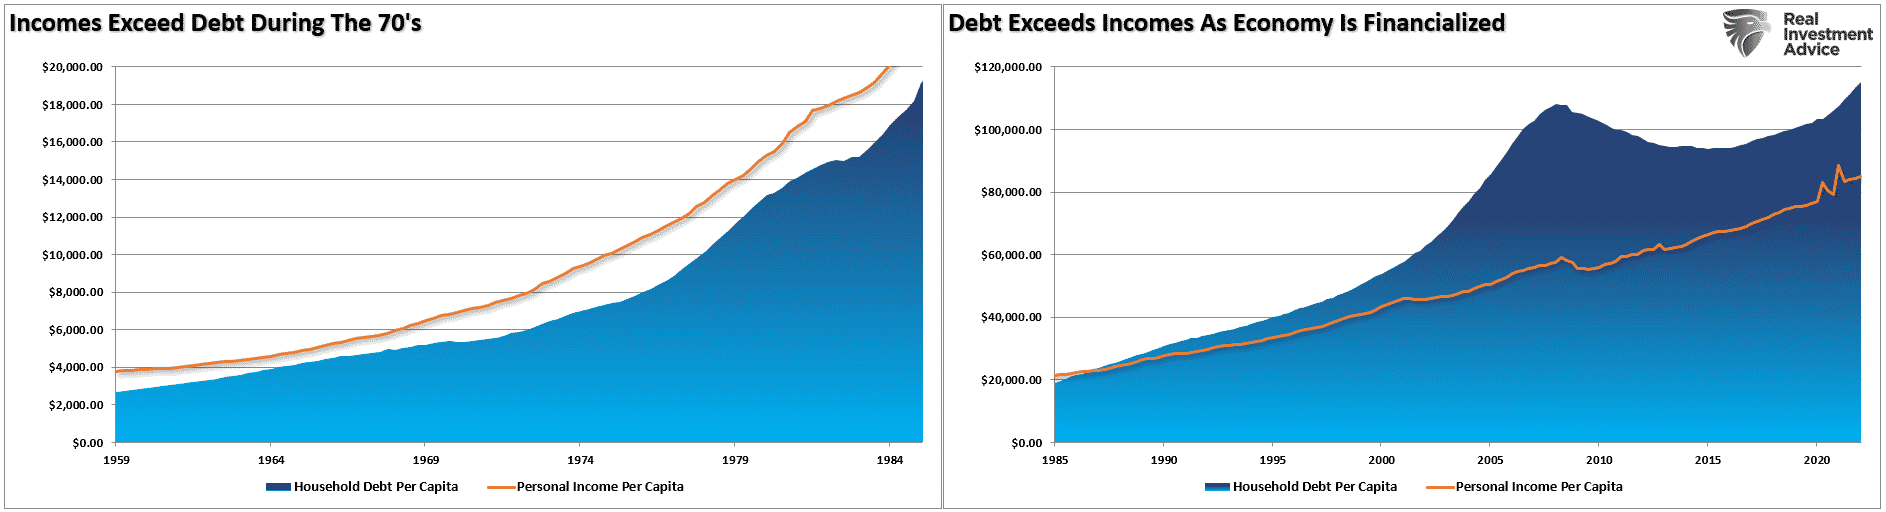
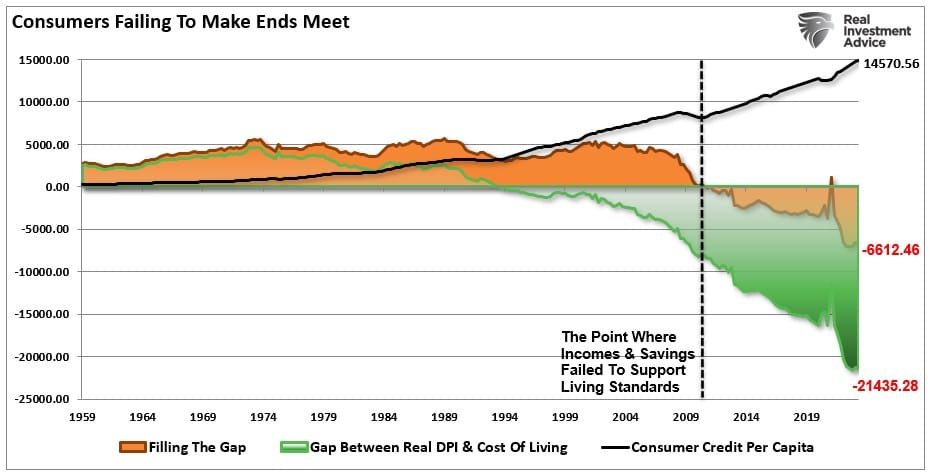
With the Government running a deep deficit with debt exceeding $32 trillion, consumer debt at record levels, and economic growth rates fragile, consumers’ ability to withstand higher inflation and interest rates is limited. As noted previously, the “gap” between income and savings to sustain the standard of living is at record levels. The chart shows the gap between the inflation-adjusted cost of living and the spread between incomes and savings. It currently requires more than $6500 of debt annually to fill the “gap.“
It Is Not The Same
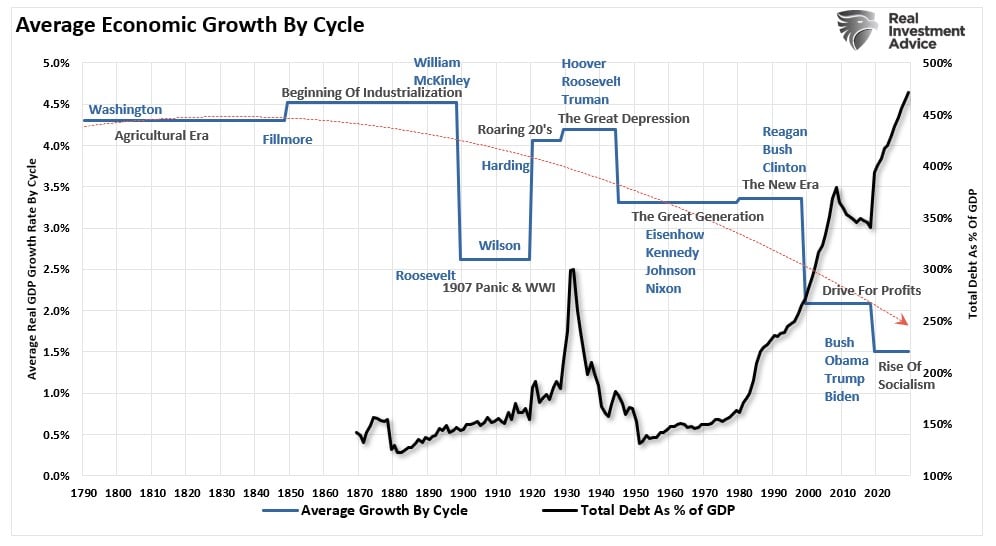
While the Fed is currently engaged “in the fight of its life,” trying to quell inflation, The economic differences are vastly different today. Due to the heavy debt burden, the economy requires lower interest rates to sustain even meager economic growth rates of 2%. Such levels were historically seen as “pre-recessionary,” but today, they are something economists hope to maintain.
This is one of the primary reasons why economic growth will continue to run at lower levels. Such suggests we will witness an economy:
- Subject to more frequent recessionary spats,
- Lower equity market returns, and
- A stagflationary environment as wage growth remains suppressed while the cost of living rises.
Changes in structural employment, demographics, and deflationary pressures derived from changes in productivity will magnify these problems.
While many want to suggest that the Federal Reserve is worried about “That 70s Show,” we would be lucky to have the economic strength to support such a concern.
The Fed’s bigger worry should be when the impact of higher rates causes a financial break in a debt-dependent financial system.