
If you woke up this morning from an eight-month coma and happened to glance through the business section of the newspaper, you’d be forgiven for being unaware of any economic slowdown.
Don’t get me wrong: Many businesses and families are still struggling. The number of Americans filing for initial jobless claims last week spiked above 1 million, while the number of deaths attributed to COVID-19 remains high.
But there’s been much else to celebrate.
Business activity in the U.S. snapped up to a post-pandemic high this month. The preliminary Composite Purchasing Manager’s Index (PMI), a measure of both the manufacturing and services sectors, hit an expansionary 54.7, the highest since February 2019. The upturn was due primarily to stronger exports and new orders as overseas economies continue to reopen. China is also currently positive, as I shared with you last week, meaning 40 percent of the world’s economy is now in expansion mode once again.
To learn more on the PMI, watch the video above, taken during my keynote speech at the Vancouver Resource Investment Conference (VRIC). Please also remember to subscribe to our YouTube channel and share with your friends!
U.S. homebuilders are incredibly bullish right now. This month’s National Association of Home Builders (NAHB)/Wells Fargo Housing Market Index climbed to 78, matching a previous all-time record set in December 1988. While I’m on the subject, sales of existing homes soared almost 25 percent in July from June, the strongest monthly gain in U.S. history, on near-zero interest rates.
Finally, the S&P 500 closed at a new record high last Tuesday, ending the shortest bear market in U.S. history. The pandemic-induced pullback lasted only 33 days, compared to the median bear market length of 302 days based on data going back to the 1920s, as Reuters reports.
It’s this final point I’d like to focus on. Is the U.S. stock market’s incredible recovery justified, or is it “irrational exuberance” all over again? Year-to-date, the S&P has outperformed equities in nearly every other major economy, including the European Union (EU), United Kingdom (UK), Hong Kong and Japan. A lot of this has to do with the performance of tech stocks (more on that later), but something else appears to be happening here.
Investors Pricing In Optimism
In a recent whitepaper, GMO’s James Montier questions the rationality of higher U.S. equity valuations “in the face of overwhelming uncertainty.” He colorfully compares the stock market to the “hapless Wile E. Coyote, running off the edge of a cliff in pursuit of the pesky Roadrunner but not yet realizing the ground beneath his feet had run out some time ago.”
Interestingly, Montier doesn’t believe the market’s steady uptrend is correlated with the Federal Reserve’s or U.S. government’s unprecedented levels of monetary and fiscal stimulus. Why? Because both Japan and the EU have comparatively low interest rates and asset-buying programs, and yet “they aren’t witnessing stock market valuations at nosebleed-inducing levels” as the U.S. is.
Instead, Montier believes investors are simply pricing in an overly rosy outcome—from the pandemic, from the economic slowdown—which he says is “absurd.”
I’m not so sure. I believe in the wisdom of crowds, and that markets have gotten it right far more often than they’ve been wrong. Earlier in the month, for instance, I showed you that investors have historically predicted the outcome of presidential elections with a surprisingly high level of accuracy.
More recently, millennial Robinhood investors accurately called the bottom in airline stocks, and they continued to accumulate shares even after Warren Buffett announced in early May that he had dumped his holdings in domestic airlines.
Are We in a Tech Bubble? CLSA Says No
Something else Montier doesn’t bring up in his whitepaper is that tech stocks have driven much of the U.S. market’s gains since March. Were it not for a handful of them, the S&P 500 may have performed more in line with other economies’ stock indices.
Between the market bottom on March 23 and August 20, shares of Apple, Amazon, Microsoft, Facebook, Alphabet and graphics processor designer NVIDIA were responsible for an incredible 33 percent—an entire third—of the uptrend in the S&P 500.
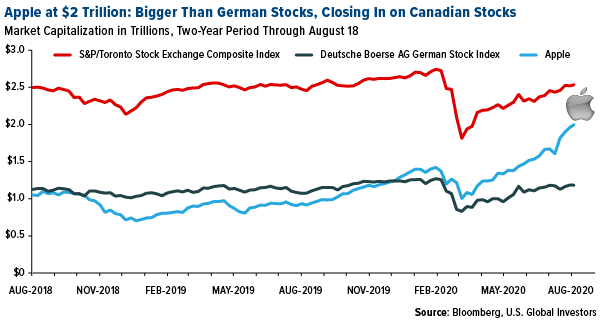
Apple alone was responsible for more than 11 percent of the market’s moves. Last week, the iPhone-maker became the first U.S. company to surpass $2 trillion in market capitalization, nearly as much as all the companies in the Russell 2000 Index of small-cap stocks combined. Apple is now valued more highly, in fact, than German stocks in the Deutsche Boerse Index and is closing in on Canadian stocks in the S&P/TSX Composite Index.
And then there’s Tesla, whose stock we really like. Tesla isn’t a member of the S&P 500 (yet), but its shares cracked $2,000 last week ahead of its stock split, bringing its market cap to $370 billion. As of Wednesday, that was enough to make the electric vehicle manufacturer more valuable than Walmart.

Some see a bubble forming. But in an interesting report dated August 12, CLSA analysts Laurence Balanco and Jonathan Estrada argue that tech doesn’t yet meet the requirements of a bubble, based on observations from the past 43 years. Those seven criteria are: 1) price gain of 555 percent over a 52-month period, 2) rising trend for four years or more, 3) gains of over 119 percent over the past 12 months, 4) 55.7 percent premium to its 200-day moving average, 5) 10-day average true range (ATR) of over 2.4 percent (volatility), 6) prime momentum divergence and 7) churning price action or a V-shaped reversal pattern.
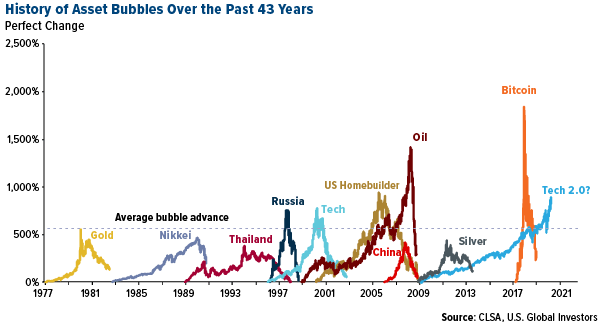
According to Balanco and Estrada, the Nasdaq 100 (tech stocks) meets only three of those seven criteria, as does the price of silver, which some people have also said may be in a bubble.
We should also add gold to that list. Even though a short-term correction in its price was expected after rising for nine weeks straight, we’re nowhere near a gold bubble.
In fact, I maintain my call of $4,000 gold over the next three years due to unprecedented global economic stimulus and money-printing.
Colombia’s Classic Case of the Gold Love Trade
On a final note, Colombia sold 67 percent of its gold holdings, valued at $475 million, in June, just weeks before the yellow metal hit its all-time high of $2,075 an ounce. Even though the timing could have been better, it was a smart move by the South American country. According to Bloomberg, the sale was based on “optimization exercises,” in which the central bank “monitors interest rates and asset volatility to determine its international reserve portfolio holdings.”
This is classic Love Trade. As I’ve said many times before, it’s rational and prudent to hold gold for love of family and country. Once Colombia finds itself in a better financial situation, it can buy the gold back.
Speaking of gold and Colombia, one of our favorite gold mining stocks remains Gran Colombia. Headquartered in Toronto, the company is the largest gold producer in Colombia. It’s high-grade, and based on a cash flow basis, it’s the cheapest gold stock among 75 gold stocks in our investible universe. It trades at only three times cash flow whereas a basket of gold miners trades at closer to 13 times cash flow. Gran Colombia currently has a free cash flow yield of 15 percent, compared to large-cap Barrick, which has one of only 4 percent. It trades on the TSX under the ticker GCM and in the U.S. under the ticker TPRFF.
Related: Markets Have Outperformed When a President Seeks Reelection