
Written by: Monica Kingsley
Stocks have closed between two strong resistances yesterday – between the upper border of March’s gap and the 61.8% Fibonacci retracement. But the overnight rise in US-China tensions (this time, regarding Hong Kong), sent the S&P 500 futures below the key Fibonacci retracement. Can stocks recover and finish the job of breaking higher?
While it may not happen today, it’s nonetheless still likely in the near future.
S&P 500 in the Short-Run
Let’s start with the daily chart perspective (charts courtesy of http://stockcharts.com):
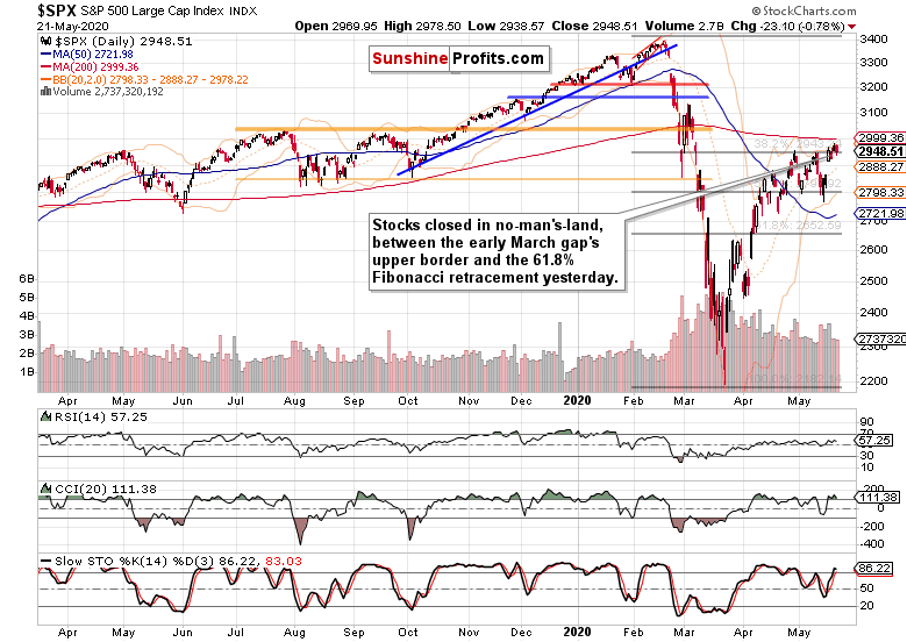
Stocks are increasingly cutting into the combined resistance posed by the early March gap and the 61.8% Fibonacci retracement, and this week’s daily downswings were only able to achieve higher lows. It means that it’s two steps forward, one step backwards for the stock bulls.
Apart from the Hong Kong jitters, there hasn’t been any other catalyst or development that would prompt the markets to reassess the risks. While it’s true that there needn’t be a catalyst, the overnight move lower appears of limited shelf life. Flash in the pan, in other words. The chart posture remains bullish, and we see it likely that the buyers would take on the 200-day moving average (that’s around 3000) before too long.
Yesterday’s volume doesn’t mark a reversal either, and the daily indicators keep supporting the unfolding upleg. When will more buyers jump onboard? Once they do, we expect FOMO (fear of missing out) to become dominant over the wait-and-see approach of this extended consolidation.
Yes, it proved to be a consolidation, because no matter how bearish or bullish the indications for a move either way, stocks kept frustrating both the buyers and sellers equally. As a rollover to the downside never came, the chart pressure to move higher keeps building with each passing day and week, in our opinion.
The Credit Markets’ Point of View
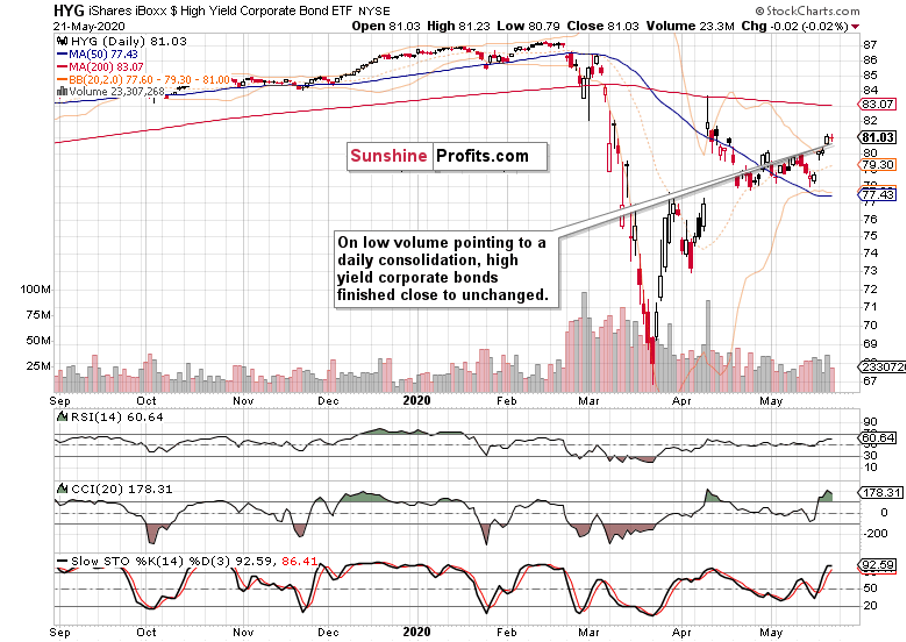
High yield corporate debt (HYG ETF) didn’t really move lower yesterday, and the daily volume hints at merely a daily consolidation of recent gains. This leading metric of credit market health is primed to go higher, and serve as a tailwind for stocks.

Yesterday’s pullback in stocks appears no cause of concern, as it’s just a short-term breather during the daily consolidation in the high yield corporate bonds to short-term Treasuries ratio (HYG:SHY).
Key S&P 500 Sectors and Ratios in Focus
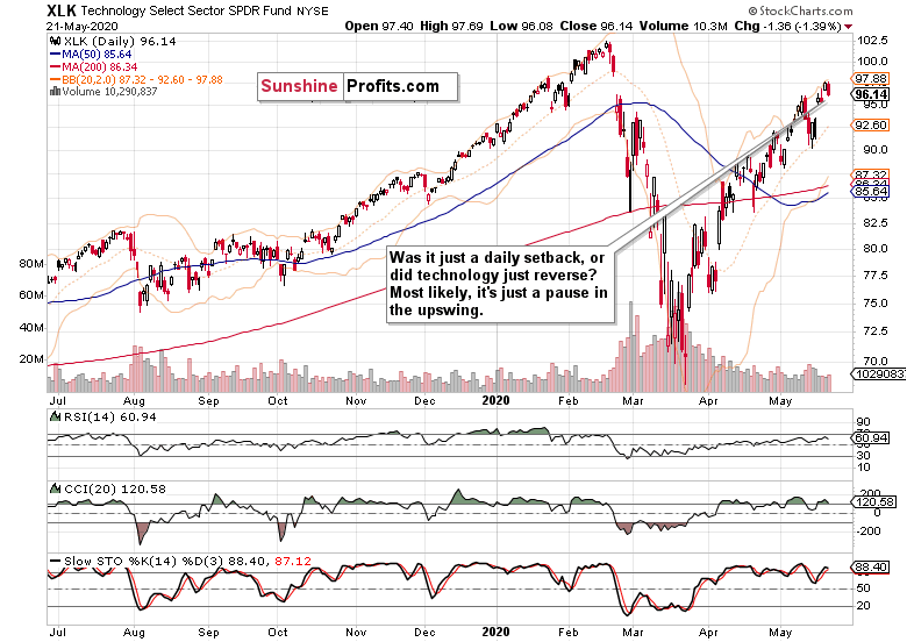
Yesterday’s sizable red candle lacked volume to make it stand out, which is why we think it’s just a daily event. Once it plays out entirely, tech will likely move higher again, pulling the index along.
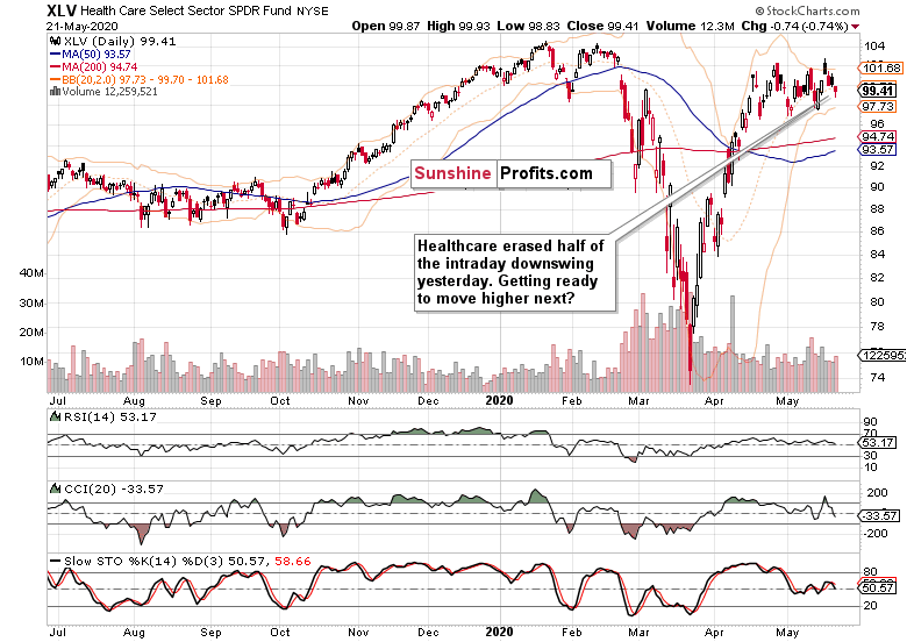
Healthcare (XLV ETF) would be an unlikely ally in the stock upswing resumption. Actually, that was a quip – it wouldn’t be at all unlikely and definitely not out of the blue. The slight increase in yesterday’s volume coupled with half of intraday losses being erased, speaks in favor of higher values not too far ahead.
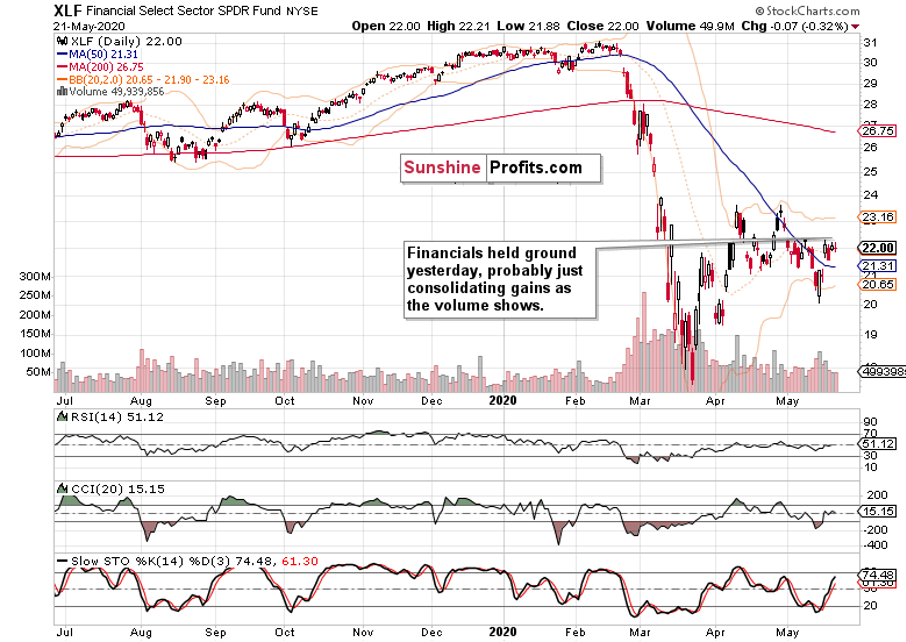
Alongside the HYG ETF, financials (XLF ETF) held steady yesterday, and the decreasing volume together with the daily indicators’ posture (they haven’t rolled over to the downside) favors the move higher to continue, and break above the early May highs.
Once again, consumer discretionaries (XLY ETF) refused to move lower while the consumer staples (XLP ETF) declined. The predictable result is another move higher in the consumer discretionaries to staples ratio (XLY:XLP). These were our yesterday’s thoughts about the importance as it:
(…) is already trading well above its February highs. Given the degree of real economy destruction seen around, that’s quite a signal this leading indicator is sending. The financials to utilities ratio (XLF:XLU) looks to have stabilized not too far from the declining resistance line connecting its mid-March and early-May intraday tops, and it’s our opinion that it would go on to break higher.
The XLF:XLU ratio probed the above-mentioned declining resistance line. While it didn’t break higher yet, it didn’t decline either. Our expectations for it to break higher remain intact.
Among the stealth bull market trio, there was no breakthrough either way yesterday. Energy (XLE ETF) moved lower, but didn’t give up this week’s gains. Neither did materials (XLB ETF). Comparatively, industrials (XLI ETF) performed best. Overall, that marks consolidation of recent gains, and building a base for an eventual launch higher across these sectors. Yes, that’s true despite the lower low made last week in industrials, or retesting it in materials.
Summary
Summing up, yesterday’s decline doesn’t pose an obstacle for the bullish outlook for the S&P 500. Its overnight part being headline-driven would likely be of limited lasting power, and we expect stocks to break above both formidable resistances on a lasting basis. Yes, the 61.8% Fibonacci retracement breakout will likely be confirmed, and so will the upper border of the early March gap. Both the credit market and sectoral strength examination supports this conclusion. Thereafter, the bulls would target the 200-day moving average at around 3000. That’s for starters, as we expect to slowly grind higher overall despite the high likelihood of sideways-to-slightly-down trading over the summer. But before that, the ball remains in the bulls’ court.
Related: Will Powell Decouple Gold from the Stock Market?