
There are a pair of expressions floating around more than usual lately. Perhaps you have heard of them:
-
The S&P 500 hit an all-time high!
-
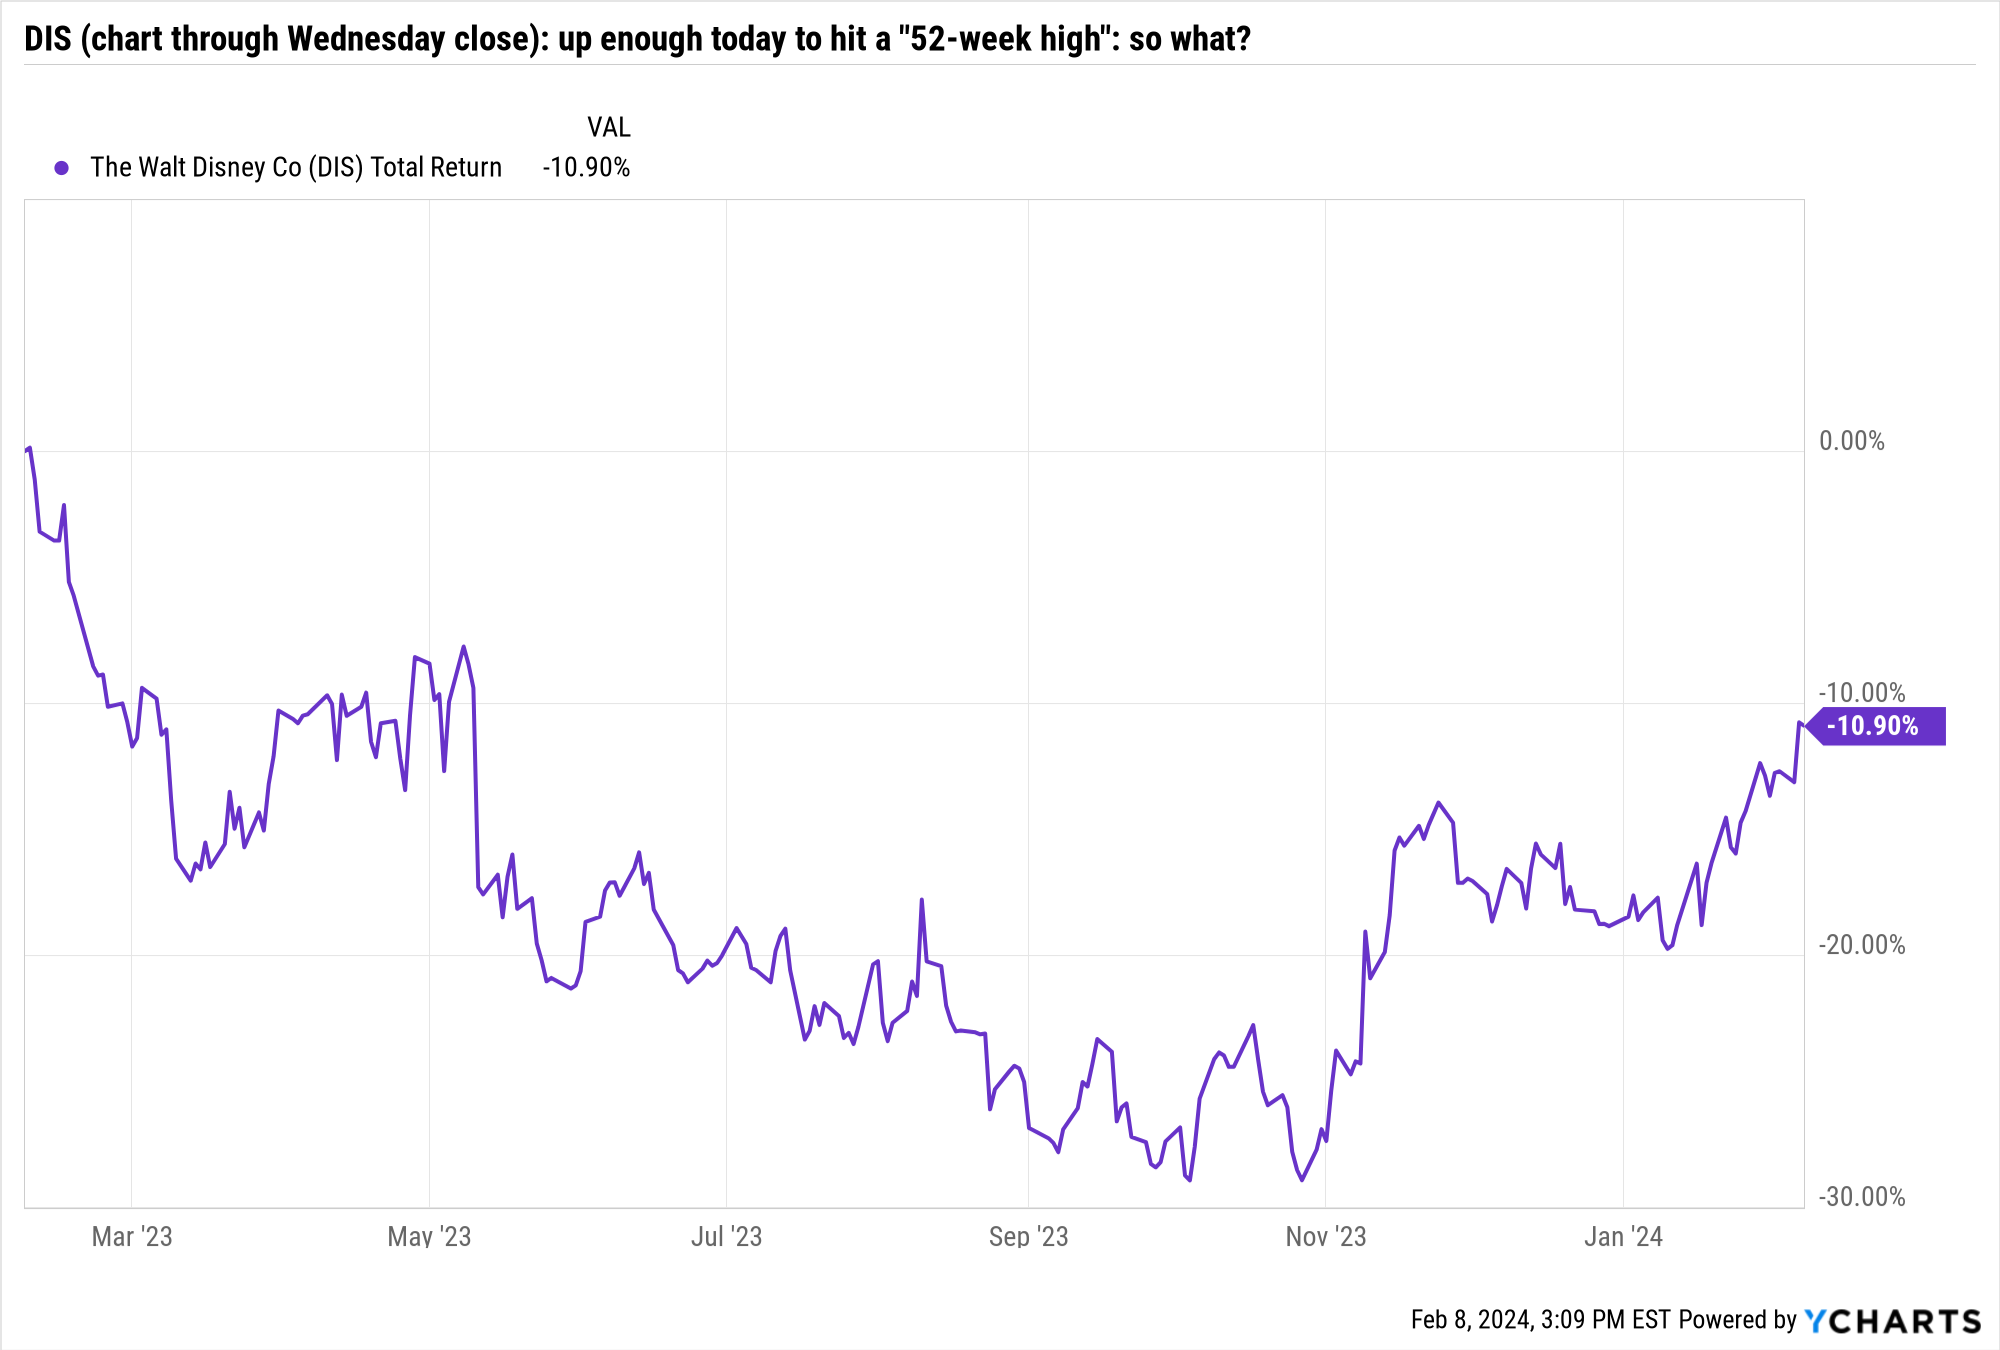
XYZ stock (say, Disney this morning) hit a 52-week high!
I classify these types of headlines as “information”. And do you know what information gets you if it is all you take in as an investor? A headache!
Information overload is everywhere.
Now, about those headlines
Ignoring the fact that most of the stock market looks nothing like this, the S&P 500 recently hit an “all-time high.” Wonderful. But when that all-time high was really the last step in a 2 year peak to trough to peak process for this index, some might think of it more as 2 years of nothing, or a waste of 2 years’ time, if you prefer. I’m not trying to be a downer, just putting the facts in perspective.
So often, we are told half the story by entities who are counting on our limited attention span. Don’t let them do that to you.
|
|

Disney zoomed higher today to a “52-week high.” In other words, its return the past 12 months, when T-bills returned about 5%, was zero. But at least holders of DIS had a chance to experience the stock market’s version of Magic Mountain.
|
|
Rob, is there another way to approach things like this?
Glad you asked. Yes, we can look not at fixed time frames or snapshot summaries of events or data that merits some collateral analysis. Here’s my own way of thinking of the investment process:
-
Information - soak it up, but don’t jump to conclusions about it immediately
-
Analysis - like looking through the entire house before you buy it, not simply seeing it from the driveway and saying “I’ll buy it!”
-
Balance: just like our ROAR Score, investing is not black or white, it is continuously adjusting “shades of grey” (not a movie reference!).
-
Decisions: one of the best pieces of advice I learned as an investment newbie (1980s) was this: before you decide to act (buy, sell, adjust, whatever), try to “kill the story.” In other words, a value-added second-guess fest, not to confuse yourself, but to convince yourself that you are making a decision with your hard-earned money that doesn’t have risks that you’ll later kick yourself for not recognizing.
That’s investing. The other stuff is just hype and mythology…and there’s an all-time high in that right now!
Here’s our updated depth chart, covering my relative ranking of 10 major market segments, through the ETFs that represent them.
Premium subscribers can take a look at their shared research deck Google sheet, which now has 2 updated lists I promised earlier this week, making for an easier, more to-the-point format.
-
The “Tactical 10”: 10 ETFs for fresh money, shorter-term time frame
-
The “Long-term 10” 10 ETFs for long-term aggressive appreciation potential
The ETFYourself.com Depth Chart (free version)
 |
Every day, the beat gets louder to me. Below is SPYG, which is the S&P 500 growth (or if you will, cutting out those boring value stocks). It tells the story the market seems to be giving us. This small corner of the market, dominated by huge stocks, looks like it could just keep going up. Until the momentum stops. Maybe it stops 4% higher, where it peaked in 2022 (yes, all-time high). Or maybe it blasts through and in honor of the year 2000, climbs another 10-15% so fast our heads will spin. Or, maybe it ends suddenly, at any moment.
This is what we get when markets are stretched, money has piled into indexes and algorithmic traders and leveraged players can get caught “offsides.” This is what I call high return potential/high risk of major loss. Or, for those who follow our color coded ETF ratings, a grade of RED.
|
|

Related: