
There is a widespread perception that the US and, indeed, the world, is experiencing a “global saving glut.” Former Federal Reserve Chairman, Ben Bernanke, coined this term in a famous 2005 speech.[1] The view became a component of Lawrence Summers’ (2014) resurrection of Alvin Hansen’s (1938) secular stagnation hypothesis. The twin views have become a mainstay of macroeconomic thinking of both economists and the popular press. This article questions the empirical basis for both positions. We do so by examining facts that appear to support neither opinion.
The Arguments for a Capital Glut
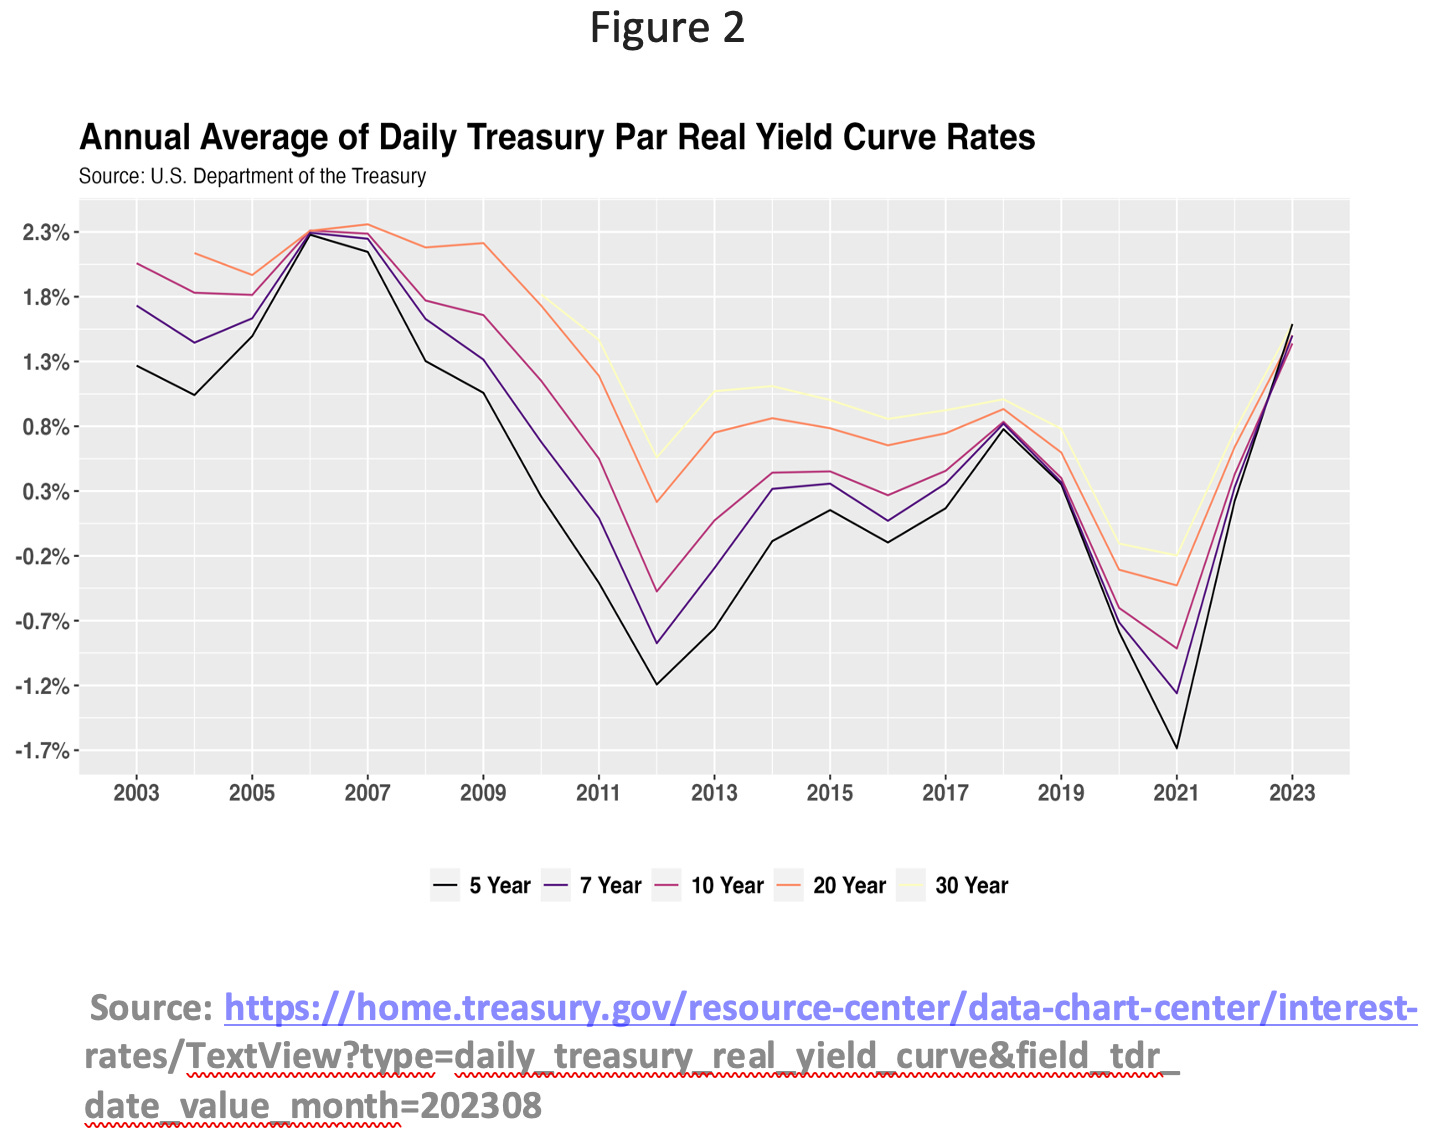
Basic economics traces the real return to capital -- the marginal product of capital – to the degree of capital intensity -- the ratio of capital to output. As capital becomes more abundant, its intensity rises, driving down its return. If the risk premium – the difference between the average return to risky capital and yields on safe government securities – remains fixed through time, declines in yields on government securities imply declines in the marginal product of capital and, all else equal, increases in capital intensity. A dramatic decline in these yields suggests a major increase in capital abundance, aka a capital glut. This is precisely what influenced the capital glut hypothesis and secular stagnation’s policy narrative. As figures 1 and 2 show, short-, medium-, and long-term real Treasury yields were not just low, but negative in roughly half of the post-2005 period.

Bernanke (2005) suggested not just a moderate rise in capital intensity, but a world awash in savings, with capital imports ensuring that even low-saving nations, like the US, would also have a surfeit of capital. Certainly, large US capital imports, i.e., sizeable current account deficits, have been a decades-long feature of the American economy.
Which countries/regions, apart from Japan and Germany, which have been running current account surpluses, are exporting capital to the US and other low-saving advanced economies? The answer is emerging countries. The list includes very high-saving countries, like China. But investors from all parts of the low-income world are seeking to invest in countries with minimal domestic risk, be it financial, real, or political. And low-risk countries are, by and large, advanced economies.
The combination of very low safe rates plus massive current account deficits, in certain counties, is the major fact pattern presented by Bernanke and referenced by Summers in support of their narratives. But they reference other factors in support of their theories. One is demographics. The world, as most everyone knows, is aging. As populations age, the life-cycle model – the model economists commonly use to predict saving behavior – predicts asset accumulation among the working population that translates into a higher wealth-to-income ratio, consistent with a capital glut.
Other potential sources of a capital glut include the rapid income growth of China and India, both high saving-rate countries, and rising inequality in the US and elsewhere, which concentrates resources in the hands of the rich, who save more than those living hand to mouth. And, some have suggested that there has been a slowdown in employment and productivity growth, making capital all that more abundant in relative terms.
Summers stresses the policy problem of a world flooded with capital. Government borrowing rates are so deeply depressed that central banks lose their ability to stimulate the economy by reducing rates even further unless there is substantial inflation. If economies can’t grow well on their own – his underlying premise -- and their central banks can’t lend a hand, fiscal policy must come to the rescue. This translates into increased deficit-finance spending. Given low borrowing rates, such a policy is, arguably, cheap. Indeed, Blanchard (2019) suggests that low government borrowing rates may make deficits free.
The Data Beg to Differ
This article argues that the US has not experienced a capital glut. As we show, there has been no major increase in the US capital-output ratio, nor has there been a major decline in the US marginal product of capital – the economy’s real return to capital. Instead, the US capital-output ratio remains close to its postwar average and capital’s real return has remained roughly constant -- around 6 percent. Yes, the US has run very large current account surpluses in recent years. But the dramatic postwar decline in America’s net saving rate has, a la Feldstein and Horioka (1980), coincided with an equally remarkable postwar decline in America’s net domestic investment rate. Thus, capital imports have limited the drop in net investment, but not enough to maintain America’s net investment rate. As a consequence, even as the population has aged, the rate of capital accumulation has not produced an increase in the capital-output ratio.
Remarkably, many adherents to the capital glut-secular stagnation view focus on gross, not net saving. Thus Mankiw (2022) points to the postwar rise in the world’s gross saving rate. But the same World Bank data on gross saving show that what’s true of the gross saving rate isn’t true of the net saving rate. The US data illustrate this point. America’s net national saving rate has dropped to 3 percent from 13 percent in the fifties and sixties – a 10 percentage point swing. In contrast, the US gross saving rate has declined by only 2 percentage points. The difference is explained by the shift in the composition of capital toward assets with higher rates of depreciation (e.g., computers and communication equipment vs. buildings).
The Capital-Output Ratio
Those proclaiming a capital gut have, it seems, made the leap from low real Treasury rates to excessive savings without directly measuring the capital-output ratio. This is readily done with Bureau of Economic Analysis (BEA) data on fixed capital (including equipment, structures, and intangible assets), valued at reproduction cost, and on net national income measured at producer prices. Figure 3 plots decadal averages of the capital-output ratio. From 1950 through 2019, the US capital-output ratio averaged 3.71. During the 2000’s, when Bernanke pronounced a capital glut, the ratio was actually slightly lower – at 3.86 – than the 3.96 ratio of the 1990s. In any case, these movements can, at most, explain only very minor changes – less than 125 basis points -- in the post-1950 marginal product. Such changes are hardly connected to the major declines in real Treasury yields documented in figures 1 and 2.

The Marginal Product of Capital
Figure 4 shows postwar decadal averages of the marginal product of U.S. capital (MPK). Our MPK calculation begins with labor’s share of net national income measured at producer prices. We calculate this variable using BEA’s NIPA data assuming that labor’s share of proprietorship and partnership income equals the economy’s overall average. The product of one minus this share times net national income provides a measure of asset income. Dividing this series by BEA’s fixed capital series provides our real capital return (MPK) series.

During the 2000’s, the period of Bernanke’s capital glut pronouncement, the MPK was a healthy 5.84 percent. In the 2010s, when Summers proclaimed secular stagnation, it was even higher at 6.42. Yet at the times of Bernanke’s and Summers’ famous speeches, the real returns on 3-month Treasuries were roughly 0 and negative 2 percent, respectively.
Why Risky Marginal Products and Safe Rates Differ
As everyone knows, equity returns are highly variable. As for Treasuries, they still represent the world’s safest asset. When Summers pitched secular stagnation, foreign ownership of Treasuries was just peaking -- at one third of the total. Even today, it’s one quarter. Hence, enhanced external risk facing foreigners can easily explain low real yields. Indeed, running in parallel to the public discussion of the capital glut has been a literature emphasizing the scarcity of safe assets (e.g., Caballero, Farhi, and Gourinchas 2017).[2] In short, we can’t infer returns to capital from Treasury yields. Yet, this inference underlies much of the discussion of the capital glut and secular stagnation by its academic proponents and media adherents.[3]
Blanchard’s Conjectured Decline in the Marginal Product
Blanchard (2019) measures the marginal product of capital based on corporate profits divided by the replacement cost of corporate capital. He finds no decline in the average return in recent decades. But he does show a higher value in the fifties and sixties. Thus, at first glance, he finds nothing supportive of Bernanke’s 2005 capital-glut claim. He does, however, conjecture that a rise in monopoly rents could explain half of corporate profits in recent years, meaning that the marginal product of capital had declined, when properly measured. His conjecture is based on a decline in recent decades in corporate profits relative to the market value of capital, which has risen relative to its replacement cost (i.e., there has been a rise in Tobin’s q.) But the market return to capital,[4] which would show a decline if there were as capital glut and investors expected lower rates of return, shows no such decline. The real return averaged 5.52 percent between 1950 and 1989. Between 1990 and 2019 it averaged 6.95. Hence, the broadest market-based real return data shows a rise, not a fall in returns in the recent decades during which capital has allegedly been in vast oversupply. Indeed, the real return to US wealth between 2010 and 2019 averaged 8.25 percent – the highest average return of any postwar decade.
US and World GDP Growth
Stagnation is an antonym for growth. Hence, secular stagnation is, first and foremost, a proposition that growth has slowed or stopped. The data say otherwise. Figure 5 shows that real US GDP has been advancing, with some noticeable hiccups, rather smoothly throughout the postwar. There is nothing in the chart suggestive of a major decline in the slope of the plot of GDP against time.

As for world GDP, figure 6 shows a much higher growth rate in the sixties and seventies than in later decades. But this is expected given the ongoing recovery from the war of Japan and Western European economies. The main point pertaining to secular stagnation is, as figure 6 indicates, real global growth has remained steady at a very respectable 3 percent. This figure hardly suggests stagnation.

The Decline in the US Net Saving and Net Domestic Investment Rates
The U.S. net national saving rate has plummeted over the past seven decades. As table 1 shows, the U.S. national saving rate averaged 14.0 percent between 1950 and 1969. Thereafter, it fell steadily, averaging just 3.0 percent over the past two decades. Since net domestic investment is, as Feldstein and Horioka (1980) observed, primarily financed by national saving, America's ever smaller saving rate has translated into an ever-smaller net domestic investment rate (net domestic investment divided by national income). Fortunately, foreign investment has slowed the drop in the domestic investment rate, raising the gap between the two series. Since net domestic investment less national saving equals the current account deficit, the U.S. has, as is well known, been running and continues to run sizable current account deficits. As table 1 also records, the domestic investment rate fell from 13.5 percent and 13.8 percent, in the fifties and sixties, respectively, to 8.5 percent in the 2000’s and just 5.5 percent over the past decade. This is hardly consistent with a capital glut.

The current account deficit widened dramatically starting in the '80s. It was 3.5 percent of net national income in the eighties and nineties, growing to 5.7 percent in the 2000’s. Over the last decade, it averaged 5.5 percent. In the 2000’s, foreigners invested more than $2 in the US for every dollar invested by Americans. In the last decade, they invested roughly $2 for every $3 invested by Americans.
The Extraordinary Decline in Postwar U.S. Household Saving
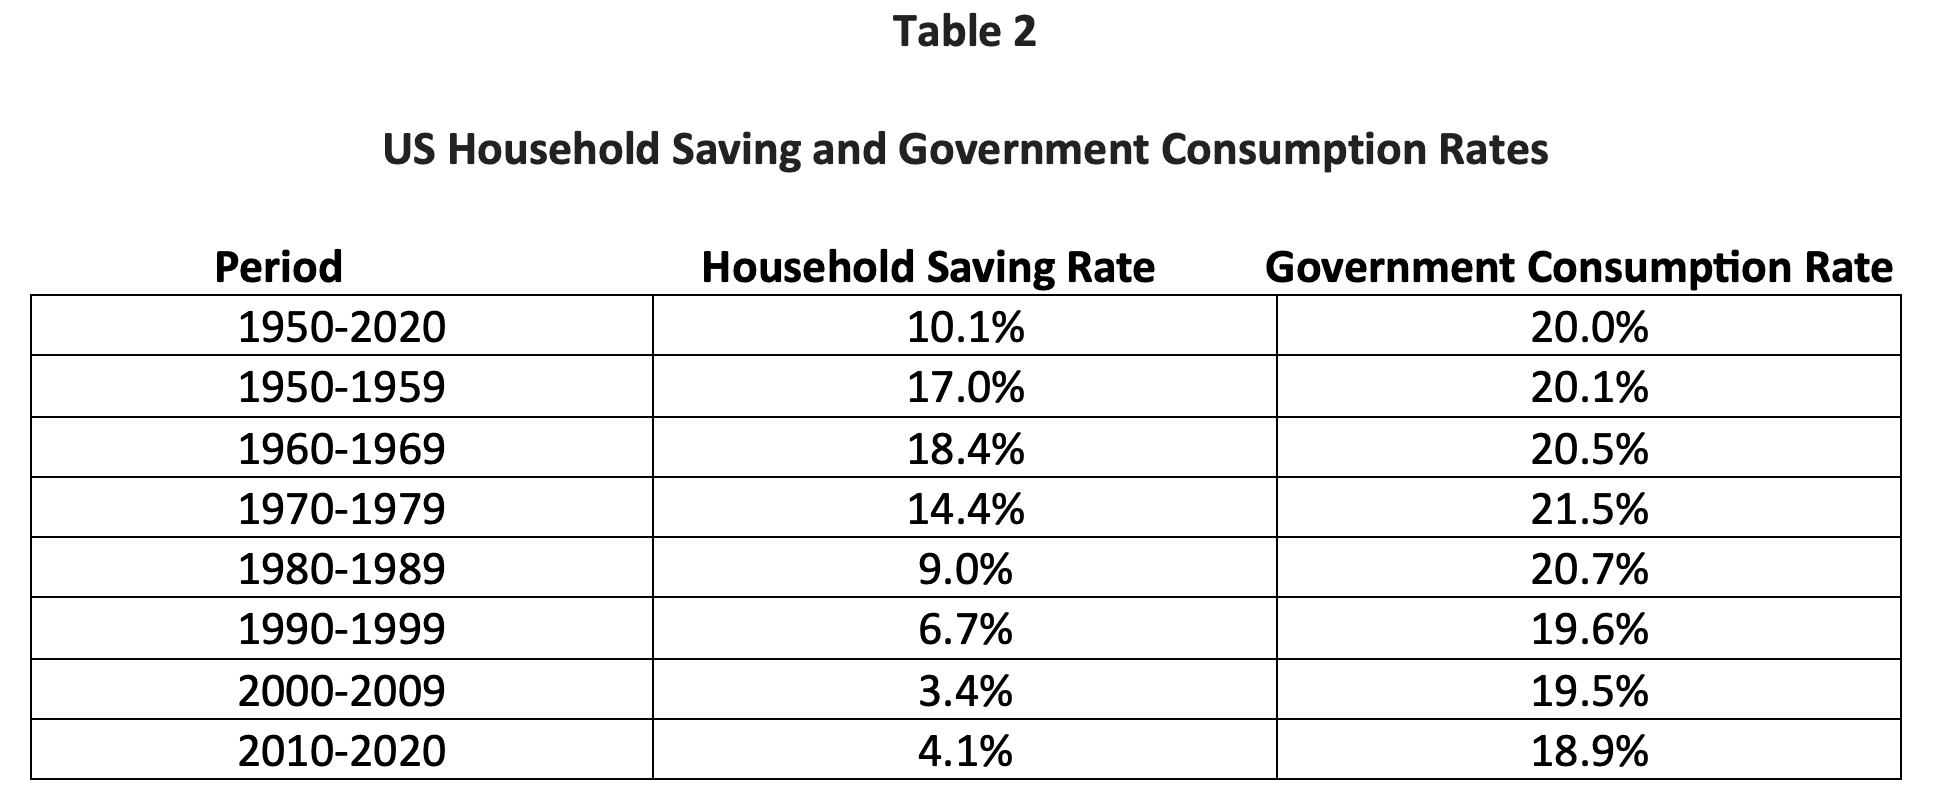
Table 2 reveals the proximate cause of the saving-rate decline. It's not the government's (federal, state, and local) propensity to consume. Government consumption as a share of national income has been running at 19 percent since 2000. It was only a point or two higher in the prior five decades. The smoking gun is the rate of household consumption. Its share of net national income was 66 percent in the '50s and '60s. Since 2000, it's averaged roughly 77 percent. Table 2 also shows the household saving rate -- the share of available national income – national income less government consumption – saved by the household sector, which has fallen as household consumption has risen. The household saving rate was 17.0 percent and 18.4 percent in the fifties and sixties, respectively. In the 2000’s and 2010’s, it was just 3.4 percent and 4.1 percent, respectively. Fueling this rise has been a marked shift in the resources available, mainly due to government intergenerational redistribution, to the elderly.
The Dramatic Postwar Rise in the Relative Consumption of the Elderly
Chart 7 displays profiles of average consumption by age for 1960, 1981, 2015, and 2021.[5] The chart confirms the dramatic postwar shift toward higher relative consumption of the elderly, a pattern initially identified in Gokhale, Kotlikoff, and Sablehaus (1996) and Lee (2014), who trace the shift to a large increase in the relative resources of the elderly resulting from a range of government fiscal policies, notably (but not exclusively) including the growth of Social Security, Medicare, and Medicaid (most of the benefits of which accrue to the elderly). Shifting the distribution of resources from the young to the old leads not only to more consumption of the old relative to the young, but also more consumption overall, according to the life cycle model, in which the old are low savers because of their short horizon. Another, complementary factor that may have led to reduced saving by the elderly is that the major social insurance programs provide benefits in the form of annuities, meaning that fewer of the resources available to the elderly are preserved in the form of precautionary saving that may eventually be left to heirs.

National Saving Rates Are Also Declining in Other Leading Economies
As documented in Dobrescu, Kotlikoff, and Motta (2012), net national saving rates declined dramatically across other major developed economies, at least during the years their study examines. The global net saving rate, calculated by the World Bank, is pictured in figure 8. The figure shows that the decline in saving in advanced economies has been offset by an increase in saving in advancing economies, but also shows no evidence of a rise in the global saving rate.

Conclusion
Our country is not suffering from a capital glut nor is it experiencing secular stagnation with excessive savings lowering the return to capital and explaining recent low Treasury yields. The US capital-output ratio is not high today. Nor was it particularly high in 2005 when Bernanke announced a world awash in savings. And the return to capital – the marginal product of capital – is not low today. Nor was it particularly low in 2005. Neither US nor global growth appear to have stopped or even slowed. US national saving and net investment have both declined dramatically in the postwar period, due to a dramatic decline in the household saving rate, which, in turn, appears to reflect a policy of redistributing from the young to the old. As a result, any increase or, indeed, decrease in wealth and capital relative to income that might have accompanied the to-date relatively minor aging of the US population has not occurred.[6]
Related: The Rebitzer Twins Brilliantly Dissect Why Americans Pay So Much for Health Care and Get So Little
[1] https://www.federalreserve.gov/boarddocs/speeches/2005/200503102/
[2] As Brumm (2022) show, there are many factors, include government-generated risk that can lower safe rates without impacting the marginal productivity of capital.
[3] See, for example, https://theconversation.com/secular-stagnation-its-time-to-admit-that-larry-summers-was-right-about-this-global-economic-growth-trap-112977. Also, see https://www.bbc.com/news/business-32163541.
[4] This procedure entails backing out the real return to national wealth by combining Federal Reserve Financial Accounts and NIPA flow data. We solve for the return rt in Wt+1 = Wt (1+rt) + wtLt – Ct – Gt, where Wt references national wealth reported in the Federal Reserve National Accounts, and wtLt, Ct, and Gt, reference NIPA-based measures of labor incomes (including the labor component of proprietorship and partnership income), household consumption, and government consumption.
[5] We thank Ronald Lee for providing these profiles.
[6] As Fehr, et al. (2013) and numerous other studies have shown, capital deepening due to aging occurs at the pace of aging, which is over decades, not years. And aging can readily reduce capital intensivity depending on the presence of pay-go and other intergenerationally redistributive as well as compulsory annuitization policies