
Written by: Jared Coffin
What a difference a week makes
Last week wasn't for the faint of heart. The market had a horrible week, and that's being kind. Half of the rally from the December 2018 low was evaporated in seven trading sessions. The sell-off itself wasn't all that surprising due to numerous technical warning signals that were popping up in prior weeks. As well as overly optimistic sentiment. However, the magnitude and velocity sure was intense and came as a surprise. The stock market bears are awake and there's no telling how long before they return to hibernation. It's wise not to poke the bear, you may not like the result.
Where the market goes from here
Most are wondering what comes next, and many have different theories. Frankly, nobody knows for sure. But looking at the charts and data can always help to determine possibilities. Currently I'm hearing a lot of the same responses. When everyone starts coming to the same conclusion, I begin to become a contrarian. The sentiment seems to be that the short-term bottom is in, and the market won't end lower in an election year.
Many are expecting the market to bounce hard forming a V-shaped recovery like we witnessed at the December 2018 lows. Due to extreme oversold market conditions a bounce is already underway and has been impressive thus far. The Federal Reserve announced an emergency 50-basis-point rate cut due to the growth-slowing fears because of the coronavirus. Although, it's premature to know what the news cycle will be over the coming weeks and what long-term damage this virus will have on the economy. It's all hypotheticals at this point based on the current available information. Now for a quick look at the current chart of the S&P 500 (SPX).
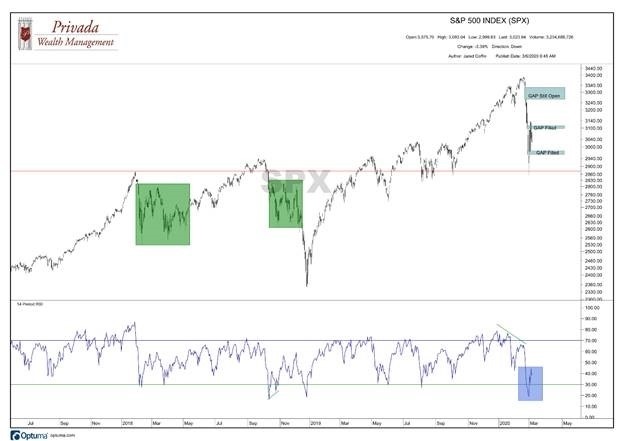
Source: Optuma
Notes from the above chart:
An oversold bounce is underway, and the RSI has moved back above 30 (illustrated in the blue box).
At the time of this writing, one more gap remains above current price. Gaps can act as resistance and some overhead supply will likely be in those areas. Two of the three gaps have already been filled and the most recently filled gap around the 3100 zone in SPX has so far acted as resistance (grey boxes labeling gaps).
The move from the December 2018 low to February 2020 high has retraced and bounced at a prior level of resistance from the January 2018 highs. And more recently that same level acted as support back in October 2019 (red horizontal line).
Most are expecting a V-shaped recovery off the lows. I'm in the camp of a W-shaped recovery and believe we may retest the lows and possibly even undercut those lows in the days, weeks and months ahead (price action much like the green boxes).
Volatility brings out both the good and bad days
It's not common to get the level of volatility we had last week while in an uptrend and above long-term moving averages - especially at that velocity. Volatility tends to cluster. The best and worst days occur close to one another and those tend to be in downtrends.
Using Optuma software, I tested the number of times SPX has had a weekly decline of 7% or more over the past 25 years. I picked 7% at random because I wanted to make sure to look for a substantial sell-off, but not so large that there were only one or two samples to show. Prior occurrences are labeled by the blue circles in the following chart. As you can see, it's rare to have that magnitude of a sell-off while in an uptrend. The majority have happened while we were already in a downtrend and moving lower.
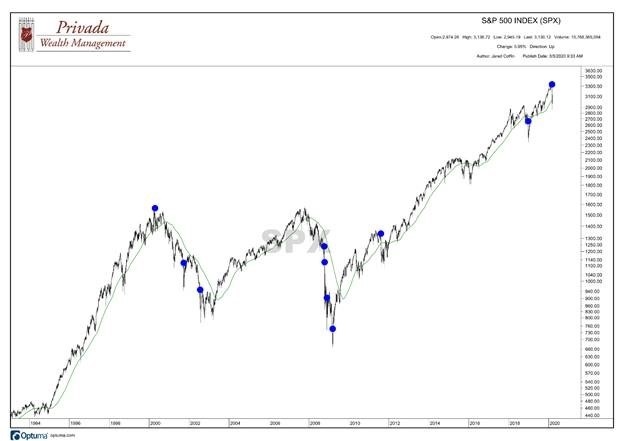
Source: Optuma
I also looked at how many times the SPX has rallied 3% or more in a single day while above versus below its 200-day simple moving average. On the following chart, blue dots label the occurrences while above and red dots label the occurrences while below. As we see, it's much more of a downtrend than an uptrend characteristic. This is just one of the many reasons I think it's too early to say the coast is all clear.

Source: Optuma
Risk comes quickly
As we've seen recently, risk happens fast, and it's difficult to make unemotional decisions once the volatility has begun. That's why it's so important to have a predetermined plan and to stick to that plan. For tactical investors that may mean raising cash levels. And those tactical investors need to be prepared for the possibility of the dreaded whipsaw. It's simply the cost of doing business. It may be wrong more times than right, but the one time it's right its payoff is substantial and is the reason you abide by such rules. That's the price you pay if you want to attempt to tactically protect your portfolio.
Likewise, for passive investors, you know this is just part of the deal. You've chosen to make no adjustments and would rather ride the index all the way up, and all the way down. Both methods can sound great to an investor when they're imagining the scenario. However, regardless of the strategy, when the volatility begins, emotions cause us to realize that it doesn't feel so good in the moment.
Having gut-wrenching swings in one's portfolio is never anyone's idea of fun. But as the great analyst Bob Farrell once said, "Excesses in one direction will lead to an opposite excess in the other direction." Extreme resets in price bring future opportunities. Try not to get paralyzed by your emotional responses at times like these and keep plugging away at your goals. Whether it be this week, this month, or this year, this too shall pass.